Figure 1.
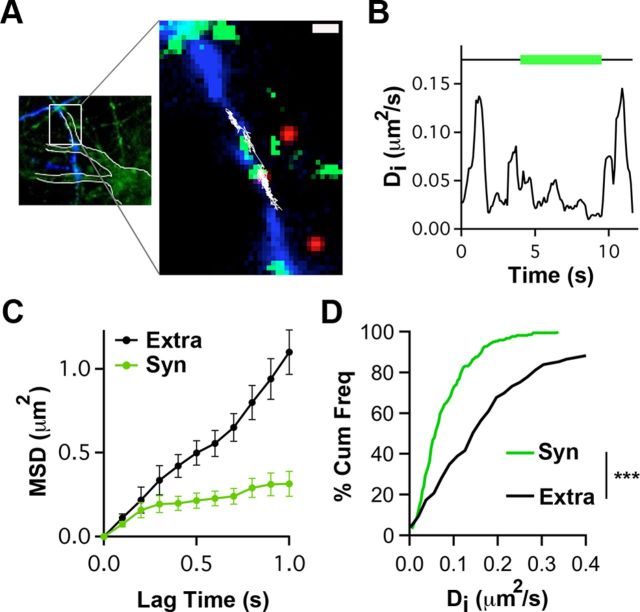
QD tracking indicates that presynaptic α7–nAChRs are constrained within synaptic space. A, Left, Hippocampal neurons in culture stained with Mitotracker (green) and transfected with Sph–GFP (blue). Neuronal contours (white boundaries) and transfected axonal trajectories were visualized by saturating the Mitotracker and Sph–GFP images, respectively. Right, Higher magnification of the left inset (white box) showing an α7–nAChR–QD complex (red) diffusing (white trajectory) on the membrane of an axon transfected with Sph–GFP (blue) and accessing synapses labeled with Mitotracker (green). Scale bar, 1 μm. B, Representative example showing the variation in Di for the α7–nAChR–QD in A as a function of time. Horizontal line indicates time in synaptic (green) and extrasynaptic (black) spaces. C, Representative example of MSD versus lag time for α7–nAChR–QD complexes in extrasynaptic (Extra) and synaptic (Syn) locations. The linear increase in MSD with time indicates free diffusion outside synapses, whereas the curved MSD with time inside synapses indicates confined diffusion. D, Cumulative distribution of Di values for synaptic and extrasynaptic α7–nAChR–QD (n = 118 and 149 for synaptic and extrasynaptic trajectories, respectively, from ≥3 independent culture sets for each condition; Mann–Whitney test, ***p < 0.001).

