Figure 2.

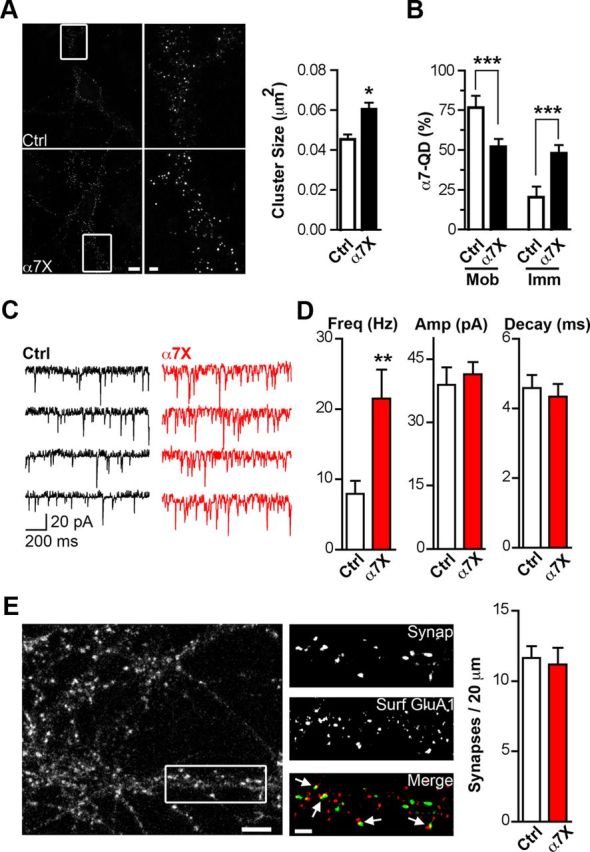
Reducing α7–nAChR mobility increases synaptic transmission. A, Left, Representative images showing α7–nAChR staining in control (Ctrl) or crosslinked (α7X) conditions. Middle, Higher magnification of the left insets (white boxes). Scale bars, 10 and 2 μm. Right, Quantification of α7–nAChR cluster size for Ctrl and α7X (n = 22 neurons, 4 culture sets; mean ± SEM; Student's t test, *p < 0.05). B, Quantification of mobile and immobile α7–nAChR–QD complexes for Ctrl and α7X (n = 18 and 26 images from 3 culture sets for Ctrl and α7X; mean ± SEM; Student's t test, ***p < 0.001). C, Sample traces of mEPSCs in Ctrl (black) and α7X (red) conditions. D, Quantitative analysis of the frequency (Freq), amplitude (Amp), and decay time of mEPSCs for Ctrl and α7X (n = 16 neurons, 4 culture sets; mean ± SEM; Student's t test, **p < 0.01). E, Left, Image shows synapsin immunostaining in hippocampal cultures. Middle, Higher magnification of the box from the left showing synapsin-1,2 staining (Synap, top), surface GluA1 staining (Surf GluA1, middle), and overlay of the two (Merge, bottom; Synap, green; GluA1, red). Arrows indicate examples of colocalization of the two, representing likely synapses. Scale bars, 5 and 2 μm. Right, Quantification of synaptic number (colocalized Synap and GluA1 puncta) for Ctrl and α7X (n = 19 neurons, 4 culture sets for both Ctrl and α7X; mean ± SEM; Student's t test, p > 0.05).
