Figure 5.
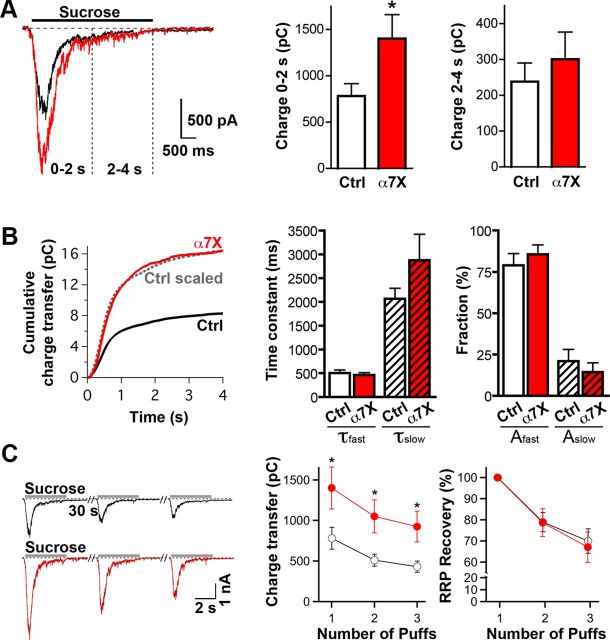
Effects of α7–nAChR crosslink on RRP capacity and kinetics. A, Sample traces (left) and summary charge-transfer graphs (right) of EPSCs induced by hypertonic sucrose (0.5 m) in control (Ctrl, black trace) and crosslinked α7–nAChR (α7X, red trace) conditions. Hypertonic sucrose was puffed using a multibarrel pipette (see Materials and Methods) onto the patched neuron for 4 s in the presence of 1 μm TTX and 50 μm gabazine. Charge transfer during the initial (Charge 0–2 s) and steady-state responses (Charge 2–4 s) were quantified to estimate the RRP size (n = 17 neurons, 4 culture sets for both conditions; mean ± SEM; Student's t test, *p < 0.05). B, Cumulative charge transfer as a function of time (left) and the corresponding kinetic analyses (right) of sucrose-induced EPSCs in control (Ctrl, black) and crosslinked (α7X, red) conditions. Dotted gray line shows the scaled control (Ctrl scaled) for comparison. The integrated charge transfer was fitted with a double-exponential function to determine kinetic parameters for the fast and slow components (τfast and τslow, respectively) and for their amplitudes (Afast and Aslow). C, Representative EPSC traces (left) and summary graphs (right) showing absolute and normalized data for RRP recovery over three sucrose applications at 30 s interpuff intervals in control (black) and crosslinked (red) conditions. RRP recovery was calculated by dividing the second and third sucrose-induced charge transfer by the value of the first and then normalized to the first current amplitude (n = 19 neurons, 4 culture sets for both conditions; mean ± SEM; Student's t test, *p < 0.05).

