
Figure 6.
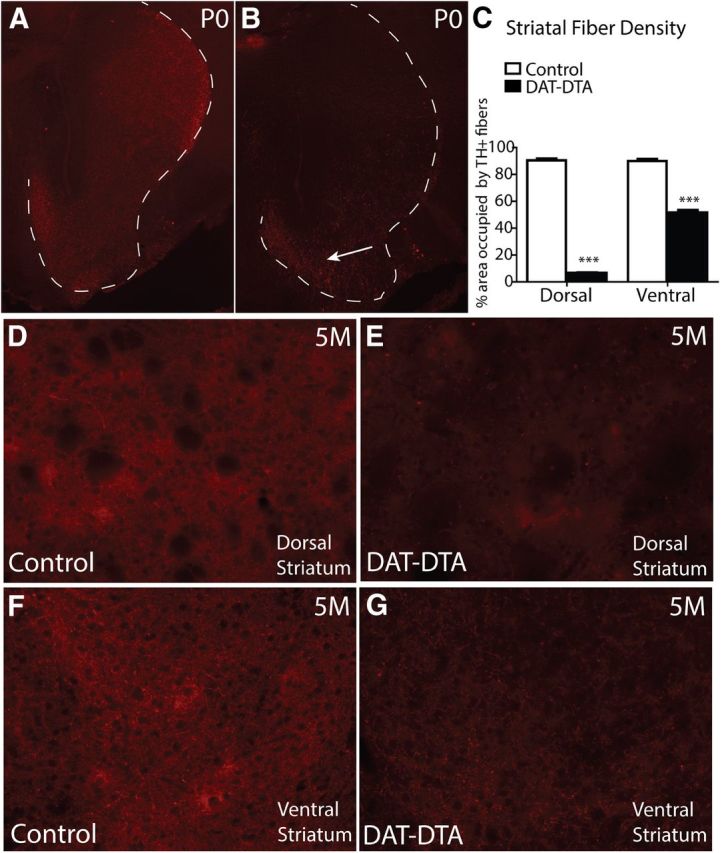
Loss of TH-positive fibers in the dorsal and ventral striatum of DAT-DTA mice. A, B, At P0, TH-positive fibers are decreased in the dorsal striatum of DAT-DTA mice compared with control mice. TH-positive fiber density is less affected in the ventral striatum of DAT-DTA mice (B, arrow). The white dotted line in A and B outlines the area of the dorsal and ventral striatum. C, Quantification of TH-positive fiber density in the striatum of 5-month-old mice reveals a significant decrease in fiber density in both the dorsal and ventral striatum of DAT-DTA mice compared with control mice (mean ± SEM, Student's t test, ***p < 0.001). N = 3 control mice, N = 3 DAT-DTA mice. D–G, Representative images used for quantifying fiber density showing decreased TH-positive fiber density in both the dorsal and ventral striatum of DAT-DTA mice compared with control mice.