Figure 1.

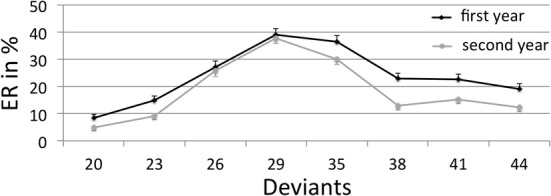
Mean error rates (ER) and standard errors in % in the non-symbolic numerical comparison task, separately for the different measurement points (first year, second year) as a function of the different deviants (reference numerosity = 32).

Mean error rates (ER) and standard errors in % in the non-symbolic numerical comparison task, separately for the different measurement points (first year, second year) as a function of the different deviants (reference numerosity = 32).