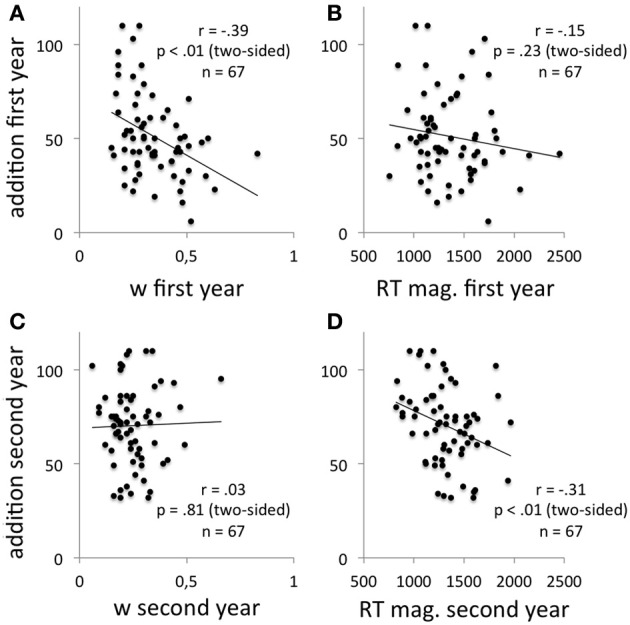
Figure 2.

Correlations between the internal Weber fractions and the addition performance in the first year (A) and in the second year (C) as well as correlations between mean RT in the non-symbolic numerical comparison task and the addition performance in the first year (B) and in the second year (D).
