Fig. 5.
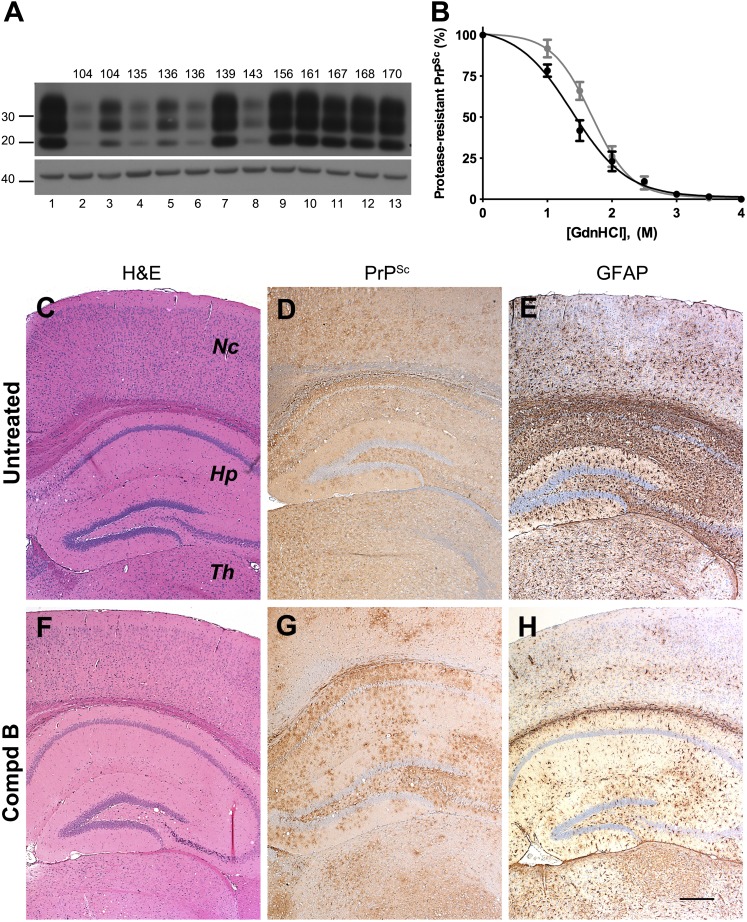
Biochemical and neuropathologic analysis of Compd B–treated Tg(MoPrP:Gfap-luc)4053 mouse brains. (A) Immunoblots of brain homogenates prepared from prion-infected Tg(MoPrP:Gfap-luc)4053 mice without Compd B treatment (lane 1) and treated with 110 mg/kg/d of Compd B beginning at 1 dpi (lanes 2–13). Each lane shows brain homogenate from a single animal, whose incubation time is indicated. Samples were probed for PK-resistant PrPSc (upper panel); actin is shown as a control (lower panel). Apparent molecular masses based on migrated protein standards are shown in kilodaltons. (B) Conformational-stability curves of PrPSc in untreated (black) and Compd B–treated (gray) Tg(MoPrP:Gfap-luc)4053 mice. GdnHCl1/2 concentrations were 1.4 ± 0.3 M (n = 6) for the untreated group and 1.7 ± 0.2 M (n = 6) for the treated group. (C–H) Immunohistochemical analysis of brain sections from untreated (C–E) and treated (F–H) Tg(MoPrP:Gfap-luc)4053 mice. H&E staining showed mild vacuolation in untreated (C) and treated mice (F). Immunostaining for PrPSc showed intense, uniformly distributed PrPSc throughout the brain of untreated mice (D) and multifocal patches of PrPSc accumulation in treated mice (G). GFAP staining showed intense astrocytic gliosis, particularly in the hippocampus, of untreated mice (E), but multifocal, moderately intense astrocytic gliosis resembling the patchy distribution of PrPSc in treated mice (H). Nc, neocortex; Hp, hippocampus; Th, thalamus. Bar in H represents 200 μm and applies to C–G.

