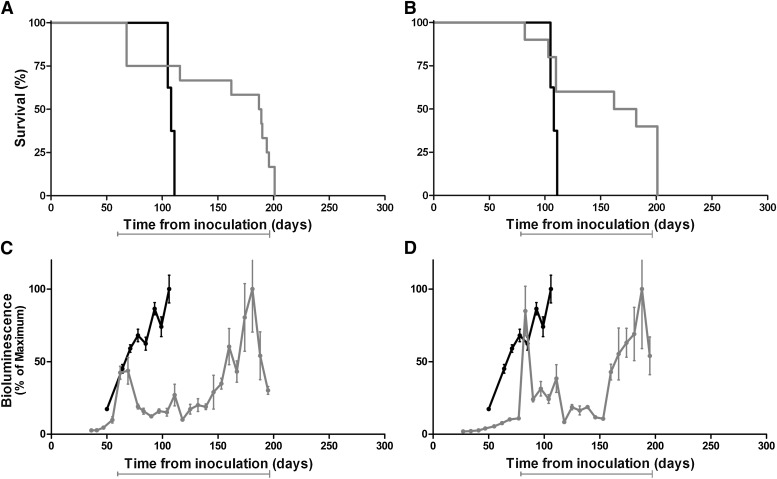
Fig. 7.
Kaplan-Meier (A and B) and BLI (C and D) curves of Tg(Gfap-luc) mice infected with RML prions and treated with 110 mg/kg per day of Compd B (gray) beginning at 60 dpi (A and C) or 78 dpi (B and D). Untreated mice are shown as controls (black). Delayed treatment resulted in shorter extensions in survival time, compared with Tg(Gfap-luc) mice treated with Compd B beginning at 1 dpi (see Fig. 3A). Mean brain bioluminescence signal expressed as a percentage of the maximum; error bars represent SEM. Bars under each graph indicate the initiation and duration of treatment.

