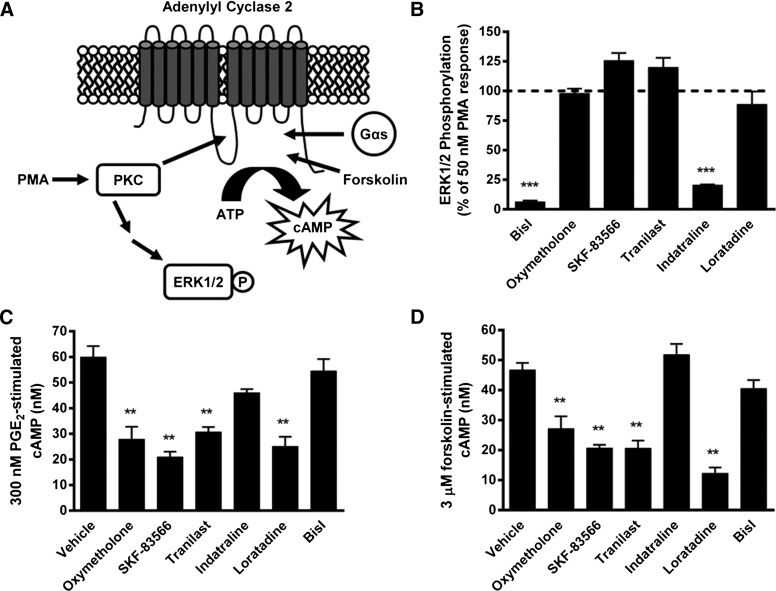
Fig. 2.
Counterscreening for validation of active compounds as AC2 inhibitors. (A) Schematic for PKC-dependent and PKC-independent activation of AC2. (B) The effects of test compounds (30 µM) on PMA-stimulated ERK1/2 phosphorylation were measured in HEK-hAC2 cells. Data are mean ± S.E.M. of three independent experiments. ***P < 0.001 (one sample t test compared with 100). (C) The effects of test compounds (30 µM) on 300 nM PGE2-stimulated cAMP accumulation and (D) 3 µM forskolin-stimulated cAMP accumulation was measured in HEK-hAC2 cells. Data are mean ± S.E.M. of three independent experiments. **P < 0.01, compared with vehicle condition, one-way analysis of variance followed by Dunnett’s post hoc test.

