This study found a strong relationship between MR imaging kinetics and maximum standardized uptake values in the triple-negative subtype, which supported the hypothesis that blood flow and glucose metabolism are highly coupled in this more aggressive breast cancer subtype.
Abstract
Purpose
To assess the relationship between parameters measured on dynamic contrast material–enhanced (DCE) magnetic resonance (MR) imaging and fluorine 18 fluorodeoxyglucose (FDG) positron emission tomography (PET)/computed tomography (CT) in primary invasive breast cancer.
Materials and Methods
This HIPAA-compliant study was a retrospective review of medical records and therefore approved by the institutional review board without the requirement for informed consent. Patients with a diagnosis of invasive breast cancer from January 2005 through December 2009 who underwent both DCE MR imaging and FDG PET/CT before treatment initiation were retrospectively identified. Fractional volumes were measured for ranges of signal enhancement ratio (SER) values from DCE MR imaging data and compared with maximum standardized uptake values (SUVmax) from FDG PET/CT data. Linear regression analysis was performed to clarify the relationship between SER and SUVmax, adjusting for tumor size, pathologic grade, and receptor status.
Results
Analyzed were 117 invasive breast cancers in 117 patients. Overall, a higher percentage of high washout kinetics was positively associated with SUVmax (1.57% increase in SUVmax per 1% increase in high washout; P = .020), and a higher percentage of low plateau kinetics was negatively associated with SUVmax (1.19% decrease in SUVmax per 1% increase in low plateau; P = .003). These relationships were strongest among triple-negative (TN) tumors (4.34% increase in SUVmax per 1% increase in high washout and 2.65% decrease in SUVmax per 1% increase in low plateau; P = .018 and .004, respectively).
Conclusion
In invasive breast carcinoma, there is a positive relationship between the percentage of high washout and SUVmax and a negative relationship between the percentage of low plateau and SUVmax. These results are stronger in TN tumors.
© RSNA, 2013
Supplemental material: S1
Introduction
Breast cancer is a heterogeneous disease that includes tumors with a broad range of therapeutic response, relapse risk, and overall prognosis. Increased understanding of this diversity motivated the use of biologically based imaging to complement the traditional anatomic-based modalities of mammographic imaging and ultrasonography (US). By revealing the functional properties of breast tumors, dynamic contrast material–enhanced (DCE) magnetic resonance (MR) imaging and fluorine 18 fluorodeoxyglucose (FDG) positron emission tomography (PET)/computed tomography (CT) are increasingly important tools in the evaluation of patients with invasive breast cancer.
Kinetic measurements obtained from breast DCE MR imaging reflect the biologic and histologic properties of tumor angiogenesis (1,2). This can be estimated by the signal enhancement ratio (SER), a semiquantitative approximation of the redistribution rate constant (3,4). Similarly, the maximum standardized uptake value (SUVmax) measured with FDG PET is a sensitive indicator for metabolic activity in breast cancer (5).
Triple-negative (TN) breast cancer that lacks estrogen and progesterone receptors and is absent of human epidermal growth factor receptor type 2 (HER2) overexpression has emerged as a focus of interest because of its aggressive natural history. Though it accounts for only 10%–20% of all breast cancers, TN breast cancer consists of a relatively large proportion of cancer deaths and has a high rate of distant metastases at diagnosis (6,7). Furthermore, TN breast cancer is more common in familial breast cancer and tends to be of higher grade at diagnosis (8).
Characteristic imaging features of TN breast cancer make it uniquely appropriate for studies of functional imaging methods. TN breast cancers are less likely than other subtypes to manifest as microcalcifications on mammographic images, and they show circumscribed margins on US scans more often, which are features that may delay the diagnosis of cancer with these traditional imaging methods (9,10). DCE MR imaging has high sensitivity for cases of TN breast cancer that are occult at mammographic imaging or US, and certain features of DCE MR imaging have high specificity for TN breast cancer compared with cancers that are estrogen receptor–positive, progesterone receptor–positive, and HER2-negative (11,12). TN breast cancer demonstrates higher SUVmax than other subtypes, and PET/CT can help identify TN breast cancer patients at increased risk of early relapse (13,14).
The aim of this study was to assess the relationship between parameters measured at DCE MR imaging and FDG PET/CT in primary invasive breast cancer. We hypothesize that a relationship may exist between these parameters and that such a relation may be more pronounced in TN breast cancer because of its more aggressive nature.
Materials and Methods
Patients and Study Protocol
The study was approved by our institutional review board and is compliant with the Health Insurance Portability and Accountability Act. This study was a retrospective review of medical records, and requirement for informed consent was waived by our institutional review board. By using the University of California San Francisco cancer registry and the radiology databases, we initially identified all patients with a diagnosis of invasive breast cancers between January 1, 2005 and December 31, 2009 at our institution who underwent both breast DCE MR imaging and whole-body FDG PET/CT examinations within 6 months before or after the date of diagnosis (222 breast carcinomas in 210 patients). Patients were excluded if either study occurred after any treatment or if the timing of therapy with respect to these studies was uncertain (104 breast cancers). One patient was found to have two distinct cancers in either breast; the smaller of these was excluded. Finally, one patient was excluded because her PET/CT data could not be reloaded for analysis. The number of days between the MR imaging and PET/CT examinations ranged from 0 to 72 (average, 7.6 days).
MR Imaging Procedure
All MR imaging examinations were performed with either a 1.5-T imager (Signa; GE Medical Systems, Milwaukee, Wis) or a 3-T imager (Magnetom Verio; Siemens Medical Systems, Erlangen, Germany) with the patient in the prone position. Although efforts were made to image premenopausal patients during days 7–14 of their menstrual cycle, exceptions were made when such timing would delay surgery. During 2005–2006, unilateral breast acquisitions were obtained in the sagittal plane by using a four-channel breast coil (MR Imaging Devices, Waukesha, Wis). Beginning in 2007, axial bilateral images were obtained by using an eight-channel breast coil (Sentinelle Vanguard, Toronto, Canada). The MR imaging protocol included a fat-suppressed T2-weighted fast spin-echo sequence and a contrast-enhanced series. The latter consisted of a three-dimensional fat-suppressed T1-weighted fast gradient-recalled-echo sequence performed before and twice after a bolus intravenous power injection of 0.1 mmol/kg gadopentetate dimeglumine (Magnevist; Bayer Healthcare Pharmaceuticals, Wayne, NJ) at 1.2 mL/sec, which was followed by a 10-mL saline flush at the same rate. The postcontrast acquisitions were obtained as two consecutive 3–5-minute scans acquired immediately after the start of contrast agent injection, in accordance with the methodologic protocol of ACRIN 6657 (15). Three time points were acquired: precontrast (S0), early postcontrast (S1), and late postcontrast (S2); S represents the corresponding signal intensity for each time point. Parameters on the 1.5-T magnet for the T1 sequences were as follows: repetition time msec/echo time msec, 8.0–8.9/4.2–4.5; section thickness, 2.0–2.9 mm; field of view, 18–25 cm; matrix 256 × 192 (unilateral); or field of view, 28–40 cm, and 512 × 192 matrix (bilateral). Parameters on the 3-T magnet for the T1 sequences were as follows: 7.1/4.9; section thickness, 0.8 mm; field of view, 28–40 cm; 512 × 481 matrix (bilateral).
FDG PET/CT Imaging Protocol
FDG PET/CT examinations were performed with either a PET/CT scanner (Biograph 16; Siemens Medical Systems) with an integrated PET and 16 multi–detector row CT scanner or a PET/CT scanner (Discovery VCT; GE Medical Systems) with an integrated PET and 64 multi–detector row CT scanner. All patients fasted with hydration for at least 6 hours. Patients had blood glucose levels less than 200 mg/dL. Patients were injected with 12.5 mCi ± 2.5 (standard deviation) of FDG intravenously followed by a 10-mL normal saline flush. Patients rested for 60 minutes ± 15 and voided before they were positioned supine on the scanner table. Unless contraindicated because of allergy or renal impairment, CT examinations were performed after a 150-mL injection of iohexol (Omnipaque 350; GE Healthcare) at 3 mL/sec. Images were reconstructed as contiguous 5-mm sections. PET was performed immediately after CT without patient repositioning. PET images were obtained in three-dimensional mode at seven to 10 bed positions per patient with an acquisition time of 3–4 minutes per station from the skull vertex through the midthigh. The CT, PET, and fused PET/CT images were displayed in orthogonal planes on a workstation (Advantage; GE Healthcare).
MR Imaging Interpretation
Acquired image data were imported and region-of-interest box volumes were manually drawn around lesions by staff members from the Breast MR Imaging Laboratory at University of California San Francisco (S.A.S., K.S.B.), who were blinded to pathologic outcome and PET/CT data. These data were reviewed and adjusted by a radiologist (M.S.B.). SER values, defined as the (S1 − S0)/(S2 − S0) ratio of early-to-late signal enhancement, were calculated on a per-voxel basis. Color-coded maps were generated within the region-of-interest box by using in-house software. Voxels with SER values between 1.3 and 1.75 and greater than 1.75 displayed high washout and very high washout kinetics, respectively. Voxels with SER values from 0.7 to 1.0 and from 1.0 to 1.3 displayed low plateau and high plateau kinetics, respectively. Voxels with SER values from 0.0 to 0.7 displayed persistent kinetics.
PET/CT Imaging Interpretation
For SUV measurement, the PET, CT, and fused PET/CT images were reviewed with a region of interest placed over any FDG-avid breast focus by two radiologists who are board certified in nuclear medicine (S.C.B. and R.A.H., 6 years and more than 20 years of experience, respectively) and who were blinded to MR images and pathologic information. An automatically generated SUVmax was recorded with its anatomic location for each PET/CT and was read by consensus.
Because of its limited spatial resolution, measurement of SUVmax on PET is likely to be underestimated for lesions that are less than twice the spatial resolution of the scanner because tumor activity may be blurred into the background. To correct for this phenomenon, known as partial volume error, we used a previously described (16) mathematical technique by using calibration measurements from each PET scanner as a function of object size. A body phantom that contained spheres of varying diameters (8, 12, 16, and 25 mm) and filled with known concentrations of FDG was placed in each PET/CT scanner. A transmission PET image was acquired from which the calculated activity of each sphere was determined and compared with known activity. From this, a mathematical look-up table was created for each PET/CT scanner to determine the underestimated SUVmax because of partial volume error.
Pathologic Assessment
We extracted data on histologic type, tumor grade, hormone receptor, and HER2 status from pathologic analysis reports. Tumor grade was defined as well, moderately, or poorly differentiated by using a modified Scarff-Bloom-Richardson grading system (17). Estrogen receptor or progesterone receptor status was positive at immunohistochemical staining of 1% or more tumor cells, and HER2 status was positive on an immunohistochemical score of 3+ or a fluorescence in situ hybridization HER2-to-chromosome 17 centromere ratio greater than 2.2. We defined TN disease as breast cancer negative for estrogen receptor, progesterone receptor, and HER2 by following that assessment.
Statistical Analysis
We evaluated the univariate relationship between DCE MR kinetic features and SUVmax by visually inspecting scatter plots and by using regression analysis. For this we used the partial volume error–corrected SUVmax data after natural log transformation to acquire a normal distribution and expressed the individual DCE MR imaging kinetics features as volume percentage (ie, volume percent SER categories of very high washout, high washout, high plateau, low plateau, and persistent). Then, we regressed the natural log transformation SUVmax data on each DCE MR imaging kinetics feature with and without adjustment for tumor volume (linearly after natural log transformation for better fit), grade (moderately, poorly vs well differentiated), and receptor status (only for the whole group or the non-TN group analyses; hormone receptor: estrogen receptor or progesterone receptor positive versus negative; HER2: positive versus negative) by using ordinary least squares linear regression. Visual inspection of model residuals confirmed an adequate fit of the continuous variables both in presence or absence of covariables.
The linear regression coefficients (β) for the volume percentage of SER categories can be interpreted as the relative percentage change in geometric mean SUVmax on an absolute percent point increase in SER color volume after [100 (eβ − 1)] transformation, where e is the mathematical constant approximately equal to 2.71828. For an easier interpretation of the results, we also showed the geometric mean SUVmax for tumors with a low and high volume percentage of the respective SER categories. For this, we estimated the geometric mean SUVmax at 10th or 90th volume percentile for each SER category as derived from the whole study population by using the defined linear regression models. We checked and confirmed that these 10th and 90th percentile values, based on the whole group, were also actual observed values within the TN and non-TN subgroups and therefore were biologically feasible. For the covariable-adjusted 10th and 90th percentile geometric mean SUVmax estimates, we used the mean value of these covariables as observed within the total group and each subgroup in the linear regression equations.
All analyses were performed with statistical analysis software (R version 2.15.1; R Project for Statistical Computing, Vienna, Austria) (18), including the package effects (19). All statistical tests were two sided, and a P value less than .05 indicated statistical significance. Estimates were reported with corresponding 95% confidence intervals.
Results
We analyzed 117 invasive breast cancers in 117 patients (Table 1). The average tumor size was 3.8 cm. The DCE MR imaging regions of interest ranged in size from 4.5 to 1584.6 mL (average, 221.8 mL). Volume, grade, hormone receptor, and HER2 status were available for 110 tumors (94.0%). Hormone receptor and HER2 were available for 115 tumors (98.2%). Of these, 24 lesions (20.5%) demonstrated the TN phenotype (Table 2). DCE MR imaging and FDG PET/CT images from a representative lesion are provided in Figure 1.
Table 1.
Characteristics of Patients and Lesions in the Overall Group and According to TN Status
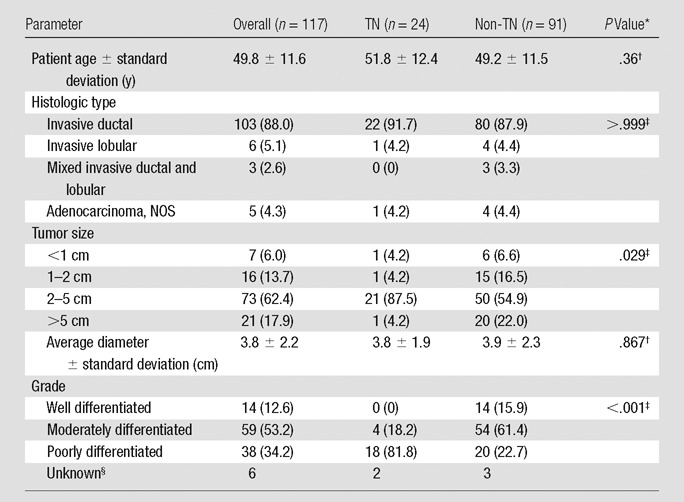
Note.—Data in parentheses are percentages. The numbers for TNs and non-TNs do not equal the overall group because of tumors with unknown biomarker status (n = 2); percentages may not equal 100% because of rounding. NOS = not otherwise specified.
P value for TN versus non-TN comparison.
Student t test.
Fisher exact test.
Excluded from comparison.
Table 2.
Tumor Receptor Status
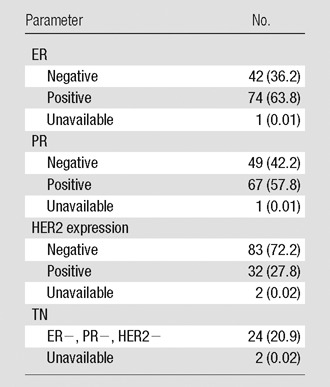
Note.—Data in parentheses are percentages. ER = estrogen receptor, PR = progesterone receptor.
Figure 1a:
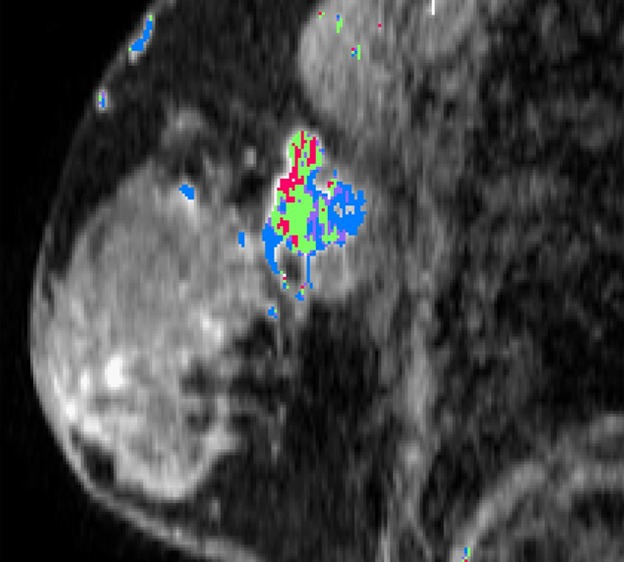
Example lesion in upper outer left breast. (a) Sagittal reconstruction of postgadolinium T1 fat-saturated DCE MR image (8.0/4.2) with SER-based color map overlay reveals high washout kinetics (red voxels). (b) Axial fused contrast-enhanced FDG PET/CT image shows a metabolically active lesion (arrow).
Figure 1b:
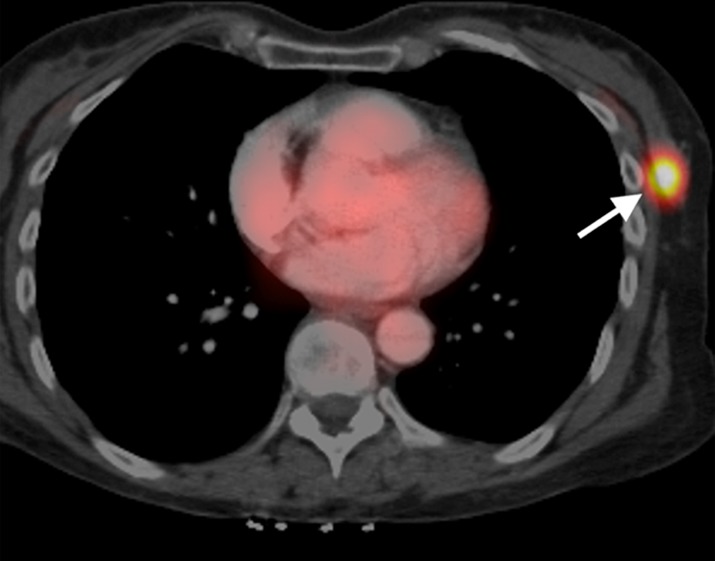
Example lesion in upper outer left breast. (a) Sagittal reconstruction of postgadolinium T1 fat-saturated DCE MR image (8.0/4.2) with SER-based color map overlay reveals high washout kinetics (red voxels). (b) Axial fused contrast-enhanced FDG PET/CT image shows a metabolically active lesion (arrow).
Seven of the 117 tumors were smaller than 10 mm, a threshold beyond which FDG PET demonstrates a known decreased sensitivity because of its limited spatial resolution (20). The correction for partial volume error on PET/CT in this study diminished the relationship between tumor size and SUVmax; this effect is illustrated in the scatter plot in Figure 2.
Figure 2:
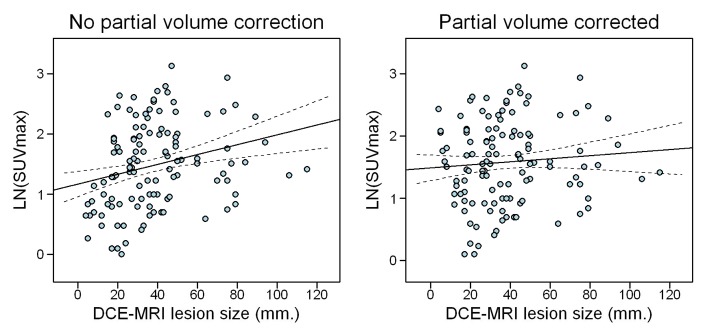
Effect of correcting SUVmax data for partial volume error, which diminishes the relationship between lesion size and SUVmax by correction of the SUVmax underestimation of small lesions. LN = natural log.
Overall, tumors demonstrated high washout DCE MR kinetics for an average 9.3% of their volume (10th–90th percentile, 1.0%–19.3%) and low plateau kinetics for 43.8% of their volume (10th–90th percentile, 25.1%–65.9%). TN breast cancer demonstrated a higher SUVmax than breast cancers that were not TN (geometric mean, 6.28 vs 4.54; P = .035), but both groups were similar regarding volume percentile high washout and low plateau DCE MR imaging kinetics (data not shown). Scatter plots that show the univariate relation between DCE MR imaging kinetics and SUVmax are in Figure E1 (online). The percent of explained variation in SUVmax was highest for high washout (R2 = 2.6% overall and 8.2% in TN breast cancer) and low plateau (4.2% overall and 17.8% in TN breast cancer).
In all tumors, higher percentages of tumor composed of high washout kinetics trended toward a positive association with SUVmax (1.22% increase in SUVmax per percentage point increase in high washout volume; P = .085), which is shown in Table 3. Correction for tumor grade, size, and receptor status resulted in a 1.57% increase in SUVmax per percentage point increase in high washout volume (P = .020). Higher percentages of tumor composed of low plateau kinetics were negatively associated with SUVmax (0.93% decrease in SUVmax per 1% increase in low plateau volume; P = .026). When corrected for tumor grade, size, and receptor status, there was a 1.19% decrease in SUVmax per percentage point increase in low plateau volume (P = .003).
Table 3.
Percentage Change in Partial Volume-corrected SUVmax According to SER Variables
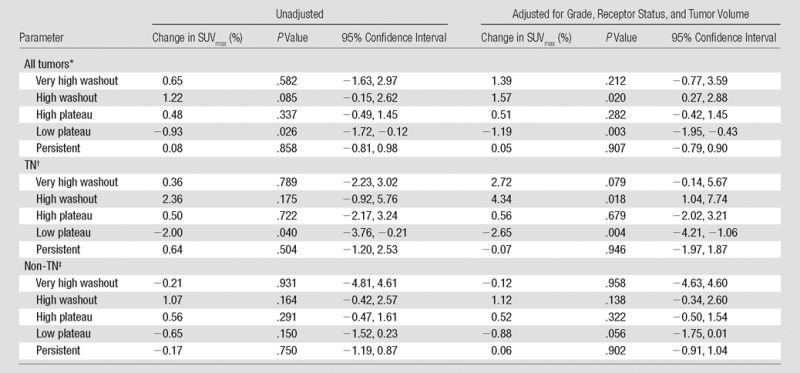
Unadjusted, n = 117; adjusted for grade, receptor status, and tumor volume, n = 110
Unadjusted, n = 24; adjusted for grade, receptor status, and tumor volume, n = 22
Unadjusted, n = 91; adjusted for grade, receptor status, and tumor volume, n = 88
Among the TN subtype (n = 24), there was a 2.00% decrease in SUVmax per percentage point increase in low plateau tumor volume (P = .040) and no statistically significant association between high washout tumor volume and SUVmax. These associations were strengthened by adjusting for grade and size, which resulted in a 4.34% increase in SUVmax per 1% increase in high washout volume (P = .018) and a 2.65% decrease in SUVmax for each percentage point increase in low plateau volume (P = .004; n = 22).
The non-TN subgroup showed a 1.07% increase in SUVmax per 1% increase in high washout volume (n = 91; P = .164) and a 0.65% decrease in SUVmax per percentage point increase in low plateau volume (n = 91; P = .150). These results were not statistically significant even after they were adjusted for grade and receptor status, with a 1.12% increase and 0.88% decrease in SUVmax for each percentage increase in high washout and low plateau, respectively (n = 88; P = .138 and .056, respectively).
Among all tumors, those lesions at the 10th percentile of volume composition of high washout at MR imaging have a geometric mean SUVmax of 4.3, while those at the 90th percentile have an SUVmax of 5.7 (Fig 3). This effect is greater among the TN subgroup, and lesions at the 10th percentile of high washout on MR imaging showed an SUVmax of 4.2 compared with an SUVmax of 9.2 for lesions at the 90th percentile.
Figure 3a:
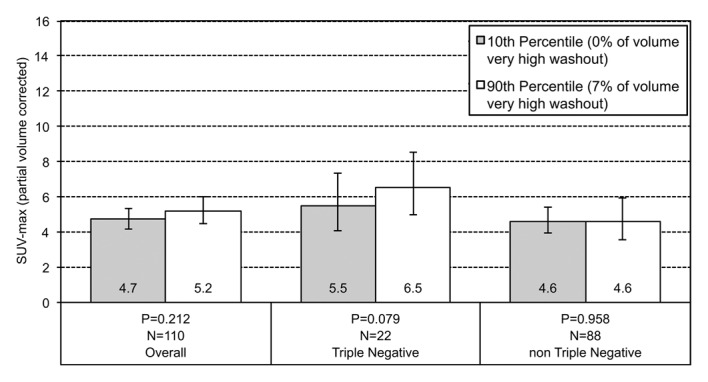
Graphs show the relationship between geometric mean SUVmax and the volume percentage of a tumor exhibiting (a) very high washout, (b) high washout, (c) high plateau, (d) low plateau, or (e) persistent SER kinetics. Depicted are differences in geometric mean SUVmax for tumors at the 10th percentile versus the 90th percentile of a SER kinetic category, adjusted for size, grade, and receptor status, for the overall group of tumors and according to TN status. For the high washout category (b), a positive association between SER and SUVmax is observed, which is stronger in the TN subtype. For the low plateau category (d), there is a negative association between SER and SUVmax that is also stronger in TN tumors. Error bars = 95% confidence intervals.
Figure 3b:
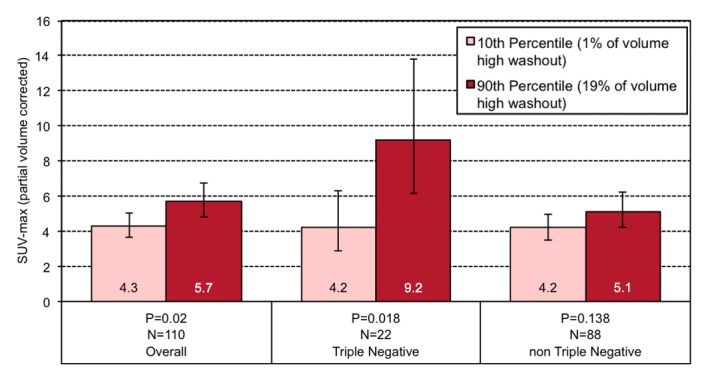
Graphs show the relationship between geometric mean SUVmax and the volume percentage of a tumor exhibiting (a) very high washout, (b) high washout, (c) high plateau, (d) low plateau, or (e) persistent SER kinetics. Depicted are differences in geometric mean SUVmax for tumors at the 10th percentile versus the 90th percentile of a SER kinetic category, adjusted for size, grade, and receptor status, for the overall group of tumors and according to TN status. For the high washout category (b), a positive association between SER and SUVmax is observed, which is stronger in the TN subtype. For the low plateau category (d), there is a negative association between SER and SUVmax that is also stronger in TN tumors. Error bars = 95% confidence intervals.
Figure 3c:
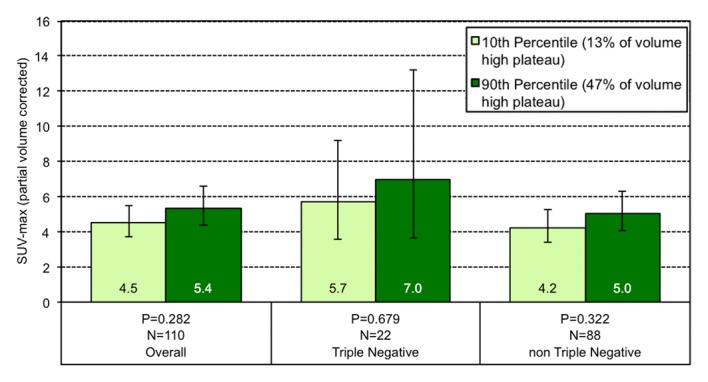
Graphs show the relationship between geometric mean SUVmax and the volume percentage of a tumor exhibiting (a) very high washout, (b) high washout, (c) high plateau, (d) low plateau, or (e) persistent SER kinetics. Depicted are differences in geometric mean SUVmax for tumors at the 10th percentile versus the 90th percentile of a SER kinetic category, adjusted for size, grade, and receptor status, for the overall group of tumors and according to TN status. For the high washout category (b), a positive association between SER and SUVmax is observed, which is stronger in the TN subtype. For the low plateau category (d), there is a negative association between SER and SUVmax that is also stronger in TN tumors. Error bars = 95% confidence intervals.
Figure 3d:
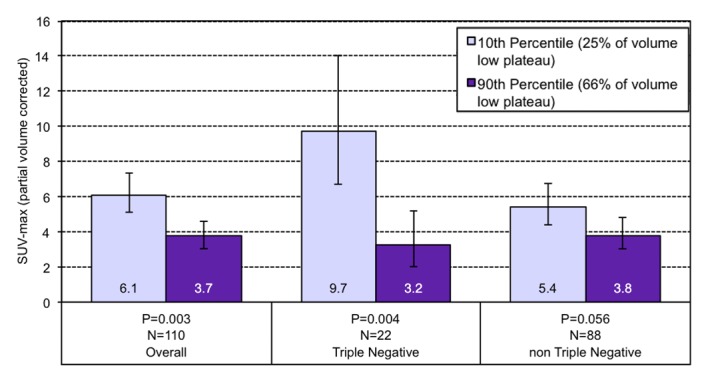
Graphs show the relationship between geometric mean SUVmax and the volume percentage of a tumor exhibiting (a) very high washout, (b) high washout, (c) high plateau, (d) low plateau, or (e) persistent SER kinetics. Depicted are differences in geometric mean SUVmax for tumors at the 10th percentile versus the 90th percentile of a SER kinetic category, adjusted for size, grade, and receptor status, for the overall group of tumors and according to TN status. For the high washout category (b), a positive association between SER and SUVmax is observed, which is stronger in the TN subtype. For the low plateau category (d), there is a negative association between SER and SUVmax that is also stronger in TN tumors. Error bars = 95% confidence intervals.
Figure 3e:
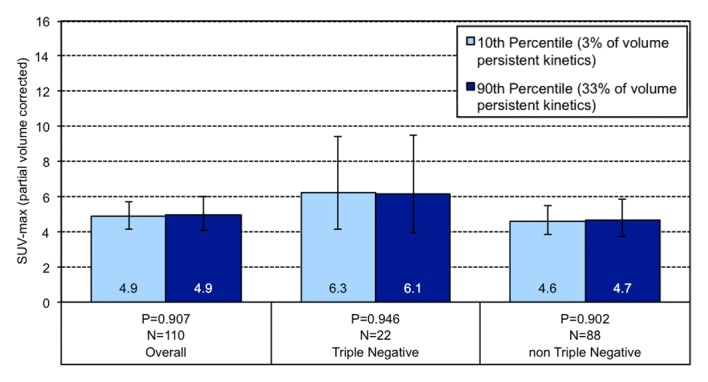
Graphs show the relationship between geometric mean SUVmax and the volume percentage of a tumor exhibiting (a) very high washout, (b) high washout, (c) high plateau, (d) low plateau, or (e) persistent SER kinetics. Depicted are differences in geometric mean SUVmax for tumors at the 10th percentile versus the 90th percentile of a SER kinetic category, adjusted for size, grade, and receptor status, for the overall group of tumors and according to TN status. For the high washout category (b), a positive association between SER and SUVmax is observed, which is stronger in the TN subtype. For the low plateau category (d), there is a negative association between SER and SUVmax that is also stronger in TN tumors. Error bars = 95% confidence intervals.
Discussion
Our results showed an association between SER and SUVmax in patients with invasive primary breast cancer who had not undergone treatment, and this relationship is particularly strong among cancers of the TN subtype. Our data showed that SUVmax increases with an increase in percentage of tumor volume that demonstrates high washout kinetics at DCE MR imaging, and that the SUVmax decreases with an increase in percentage of volume that demonstrates low plateau kinetics. Compared with all tumors, these associations were stronger and more significant in tumors with a TN phenotype. Non-TN tumors demonstrated these associations to a lesser degree and without statistical significance. Furthermore, these associations were stronger and more statistically significant after controlling for the potentially confounding variables of tumor size, tumor grade, and hormone receptor or HER2 status for both the entire group of tumors and for each subtype (TN and non-TN).
These findings support recently published work and expand on it by examining a particularly aggressive molecular phenotype. A previous study (21) demonstrated a correlation between SUV and DCE MR imaging kinetics in locally advanced breast cancer. The study was limited by a small and homogeneous sample of 20 patients, precluding analysis of molecular subtypes. A quantitative comparison of DCE MR imaging and PET/CT in rectal cancer also showed a positive correlation between the DCE MR imaging parameter kep and SUVmax, where kep is the rate constant between the extravascular-extracellular space and blood plasma (22).
There is increasing evidence (23) that suggests a pathophysiologic commonality that underlies angiogenesis and tumor glucose metabolism. Our findings underscore this complex relationship and suggest that it may differ based on the molecular subtype of a tumor. It is possible that a high degree of concordance between blood flow and glucose metabolism allows a tumor more biologic efficiency, thus conferring a more aggressive phenotype. We indeed found a stronger relationship between MR kinetics and SUVmax in the TN subtype, which supported the hypothesis that blood flow and glucose metabolism are highly coupled in this more aggressive breast cancer subtype. A weaker association in breast cancers that were not TN suggested that this relationship may be more complex for these types of tumors.
Future work may concentrate on further exploration of how the concordance between blood flow and glucose metabolism changes after therapy, and how this may specifically be applied to treatment of TN breast cancer. As certain subgroups of TN breast cancer demonstrate greater sensitivity to particular therapeutic agents, another area for future investigation would be identification of the differences in DCE MR imaging and PET/CT correlations between these subgroups for more targeted chemotherapy.
Our study has limitations. Because of our selection of patients who had undergone both DCE MR imaging and PET/CT at diagnosis, our cohort consisted largely of patients with advanced disease; therefore, the ability to generalize our results to the breast cancer population at large is limited. Additionally, despite the relatively large number of patients with both pretherapy DCE MR and PET/CT imaging, relatively few instances (24 cases) of TN breast cancer were examined. The grade and tumor size of the TN group differed from the non-TN group. Although average size of both groups was the same, the TN group was more tightly clustered in the 2–5-cm range, and the TN group contained a higher percentage of poorly differentiated tumors. The tendency for TN tumors to be high grade has been previously described (24). Although these differences in subgroups may skew direct comparisons of the TN and non-TN groups, we specifically presented the results based on percentiles of SER values (Fig 3) in a way that made both groups comparable by evaluating the subgroup-specific regression formulas at the same covariate levels (eg, same percentage of high grade tumors) for both the TN and non-TN group, which made both groups statistically comparable. An additional limitation is the long time interval between PET/CT and DCE MR imaging for some patients (four of 117 patients [3.4%] had time intervals greater than 30 days, with an upper limit of 72 days). In this small number of cases, the longer interval may have created a mismatch between SUV and SER, which may have attenuated the true underlying relations and weakening the overall results. These limitations could be addressed in a prospective study.
In conclusion, our study demonstrates an association between MR imaging kinetics and SUVmax in invasive breast cancers. Our data show that this association is particularly strong for TN breast cancers, which emphasizes the unique biologic features of this clinically aggressive subtype.
Advances in Knowledge
■ There is a positive association between high washout MR imaging kinetics and maximum standardized uptake value (SUVmax) in primary invasive breast cancer: as high washout volume increases by 1%, SUVmax increases by 1.54% (P = .020).
■ The positive association between high washout MR imaging kinetics and SUVmax is greatest and most significant for tumors that demonstrate the triple-negative (TN) phenotype: as high washout volume increases by 1%, SUVmax increases by 4.34% in TN tumors (P = .018).
Implication for Patient Care
■ This study provides additional support that imaging biomarkers, including dynamic contrast-enhanced MR imaging signal enhancement ratio and SUVmax, relate to breast cancer aggressiveness and therefore may be valuable for prognostic assessment.
SUPPLEMENTAL FIGURE
Acknowledgments
Acknowledgments
The authors acknowledge the contributions of Ann Griffin, PhD, University of California San Francisco Cancer Registry; David Newitt, PhD, University of California San Francisco Breast MR Imaging Laboratory; and Yunn-Yi Chen, MD, PhD, University of California San Francisco Immunohistochemistry Laboratory.
Received January 8, 2013; revision requested February 20; revision received March 11; accepted April 4; final version accepted May 13.
From the 2012 RSNA Annual Meeting.
S.G.E. supported by grants from the Dutch Cancer Society and Rene Vogels Foundation.
Funding: This research was supported by the National Institutes of Health (grants CA069587, CA151235, and CA132870).
Disclosures of Conflicts of Interest: M.S.B. No relevant conflicts of interest to disclose. S.G.E. Financial activities related to the present article: money paid to author’s institution for a research fellowship from the Dutch Cancer Society; money paid to author for travel support from René Vogels Foundation. Financial activities not related to the present article: none to disclose. Other relationships: none to disclose. D.J.W. Financial activities related to the present article: none to disclose. Financial activities not related to the present article: money paid to author for royalties related to optical spectroscopy system from the University of California, Regents. Other relationships: none to disclose. S.C.B. Financial activities related to the present article: none to disclose. Financial activities not related to the present article: money paid to author for royalties from Osteosynthesis and Trauma Care Foundation. Other relationships: none to disclose. R.A.H. No relevant conflicts of interest to disclose. S.A.S. No relevant conflicts of interest to disclose. K.S.B. No relevant conflicts of interest to disclose. B.N.J. Financial activities related to the present article: none to disclose. Financial activities not related to the present article: money paid to author for royalties from UpToDate. Other relationships: none to disclose. N.M.H. No relevant conflicts of interest to disclose.
Abbreviations:
- DCE
- dynamic contrast enhanced
- FDG
- fluorine 18 fluorodeoxyglucose
- HER2
- human epidermal growth factor receptor type 2
- SER
- signal enhancement ratio
- SUVmax
- maximum standardized uptake value
- TN
- triple negative
References
- 1.Esserman L, Hylton N, George T, Weidner N. Contrast-enhanced magnetic resonance imaging to assess tumor histopathology and angiogenesis in breast carcinoma. Breast J 1999;5(1):13–21. [DOI] [PubMed] [Google Scholar]
- 2.Knopp MV, Weiss E, Sinn HP, et al. Pathophysiologic basis of contrast enhancement in breast tumors. J Magn Reson Imaging 1999;10(3):260–266. [DOI] [PubMed] [Google Scholar]
- 3.Hylton NM. Vascularity assessment of breast lesions with gadolinium-enhanced MR imaging [x.]. Magn Reson Imaging Clin N Am 1999;7(2):411–420, x. [PubMed] [Google Scholar]
- 4.Li KL, Partridge SC, Joe BN, et al. Invasive breast cancer: predicting disease recurrence by using high-spatial-resolution signal enhancement ratio imaging. Radiology 2008;248(1):79–87. [DOI] [PMC free article] [PubMed] [Google Scholar]
- 5.Flanagan FL, Dehdashti F, Siegel BA. PET in breast cancer. Semin Nucl Med 1998;28(4):290–302. [DOI] [PubMed] [Google Scholar]
- 6.Podo F, Buydens LM, Degani H, et al. Triple-negative breast cancer: present challenges and new perspectives. Mol Oncol 2010;4(3):209–229. [DOI] [PMC free article] [PubMed] [Google Scholar]
- 7.Dent R, Trudeau M, Pritchard KI, et al. Triple-negative breast cancer: clinical features and patterns of recurrence. Clin Cancer Res 2007;13(15 Pt 1):4429–4434. [DOI] [PubMed] [Google Scholar]
- 8.Bauer KR, Brown M, Cress RD, Parise CA, Caggiano V. Descriptive analysis of estrogen receptor (ER)-negative, progesterone receptor (PR)-negative, and HER2-negative invasive breast cancer, the so-called triple-negative phenotype: a population-based study from the California cancer Registry. Cancer 2007;109(9):1721–1728. [DOI] [PubMed] [Google Scholar]
- 9.Ko ES, Lee BH, Kim HA, Noh WC, Kim MS, Lee SA. Triple-negative breast cancer: correlation between imaging and pathological findings. Eur Radiol 2010;20(5):1111–1117. [DOI] [PubMed] [Google Scholar]
- 10.Krizmanich-Conniff KM, Paramagul C, Patterson SK, et al. Triple receptor-negative breast cancer: imaging and clinical characteristics. AJR Am J Roentgenol 2012;199(2):458–464. [DOI] [PMC free article] [PubMed] [Google Scholar]
- 11.Uematsu T, Kasami M, Yuen S. Triple-negative breast cancer: correlation between MR imaging and pathologic findings. Radiology 2009;250(3):638–647. [DOI] [PubMed] [Google Scholar]
- 12.Dogan BE, Gonzalez-Angulo AM, Gilcrease M, Dryden MJ, Yang WT. Multimodality imaging of triple receptor-negative tumors with mammography, ultrasound, and MRI. AJR Am J Roentgenol 2010;194(4):1160–1166. [DOI] [PubMed] [Google Scholar]
- 13.Groheux D, Giacchetti S, Moretti JL, et al. Correlation of high 18F-FDG uptake to clinical, pathological and biological prognostic factors in breast cancer. Eur J Nucl Med Mol Imaging 2011;38(3):426–435. [DOI] [PubMed] [Google Scholar]
- 14.Groheux D, Hindié E, Giacchetti S, et al. Triple-negative breast cancer: early assessment with 18F-FDG PET/CT during neoadjuvant chemotherapy identifies patients who are unlikely to achieve a pathologic complete response and are at a high risk of early relapse. J Nucl Med 2012;53(2):249–254. [DOI] [PubMed] [Google Scholar]
- 15.ACRIN . Protocol 6657. American College of Radiology Imaging Network (ACRIN). http://www.acrin.org/TabID/147/Default.aspx. Accessed December 27, 2012. [Google Scholar]
- 16.Teo BK, Seo Y, Bacharach SL, et al. Partial-volume correction in PET: validation of an iterative postreconstruction method with phantom and patient data. J Nucl Med 2007;48(5):802–810. [DOI] [PubMed] [Google Scholar]
- 17.Elston CW, Ellis IO. Pathological prognostic factors in breast cancer. I. The value of histological grade in breast cancer: experience from a large study with long-term follow-up. Histopathology 1991;19(5):403–410. [DOI] [PubMed] [Google Scholar]
- 18.Core Team . R: A language and environment for statistical computing. R Foundation for Statistical Computing, Vienna, Austria. http://www.R-project.org/. Published 2012. [Google Scholar]
- 19.Fox J. Effect displays in R for generalised linear models. J Stat Softw 2003;8(15):1–27. [Google Scholar]
- 20.Heinisch M, Gallowitsch HJ, Mikosch P, et al. Comparison of FDG-PET and dynamic contrast-enhanced MRI in the evaluation of suggestive breast lesions. Breast 2003;12(1):17–22. [DOI] [PubMed] [Google Scholar]
- 21.Semple SI, Gilbert FJ, Redpath TW, et al. The relationship between vascular and metabolic characteristics of primary breast tumours. Eur Radiol 2004;14(11):2038–2045. [DOI] [PubMed] [Google Scholar]
- 22.Gu J, Khong PL, Wang S, et al. Dynamic contrast-enhanced MRI of primary rectal cancer: quantitative correlation with positron emission tomography/computed tomography. J Magn Reson Imaging 2011;33(2):340–347. [DOI] [PubMed] [Google Scholar]
- 23.Groves AM, Shastry M, Rodriguez-Justo M, et al. 18F-FDG PET and biomarkers for tumour angiogenesis in early breast cancer. Eur J Nucl Med Mol Imaging 2011;38(1):46–52. [DOI] [PubMed] [Google Scholar]
- 24.Foulkes WD, Smith IE, Reis-Filho JS. Triple-negative breast cancer. N Engl J Med 2010;363(20):1938–1948. [DOI] [PubMed] [Google Scholar]
Associated Data
This section collects any data citations, data availability statements, or supplementary materials included in this article.


