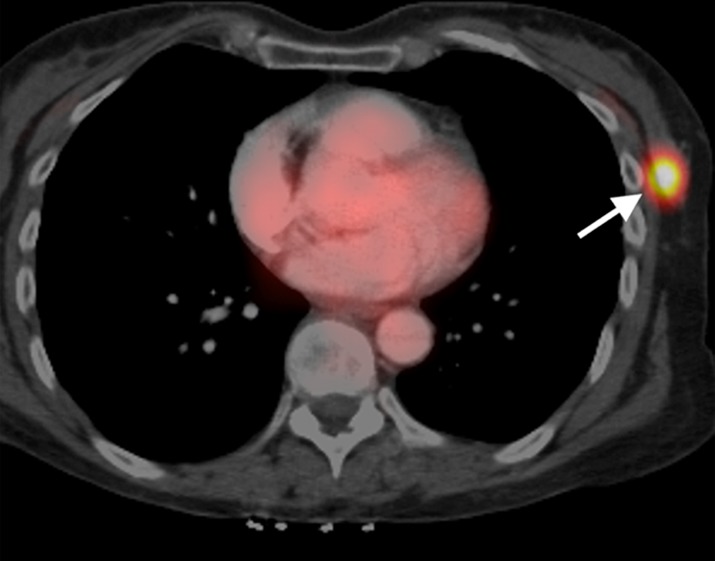
Figure 1b:

Example lesion in upper outer left breast. (a) Sagittal reconstruction of postgadolinium T1 fat-saturated DCE MR image (8.0/4.2) with SER-based color map overlay reveals high washout kinetics (red voxels). (b) Axial fused contrast-enhanced FDG PET/CT image shows a metabolically active lesion (arrow).
