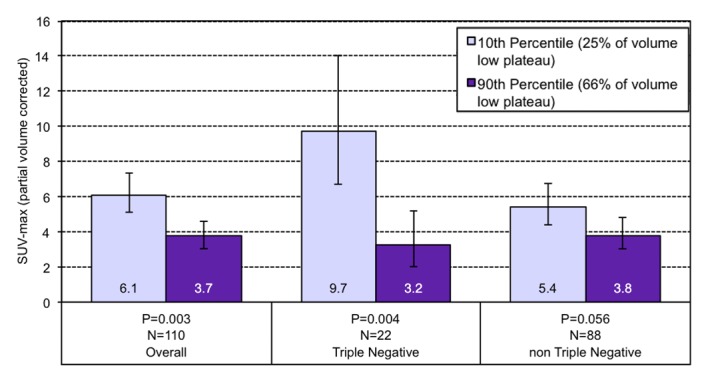
Figure 3d:

Graphs show the relationship between geometric mean SUVmax and the volume percentage of a tumor exhibiting (a) very high washout, (b) high washout, (c) high plateau, (d) low plateau, or (e) persistent SER kinetics. Depicted are differences in geometric mean SUVmax for tumors at the 10th percentile versus the 90th percentile of a SER kinetic category, adjusted for size, grade, and receptor status, for the overall group of tumors and according to TN status. For the high washout category (b), a positive association between SER and SUVmax is observed, which is stronger in the TN subtype. For the low plateau category (d), there is a negative association between SER and SUVmax that is also stronger in TN tumors. Error bars = 95% confidence intervals.
