
Figure 2b:
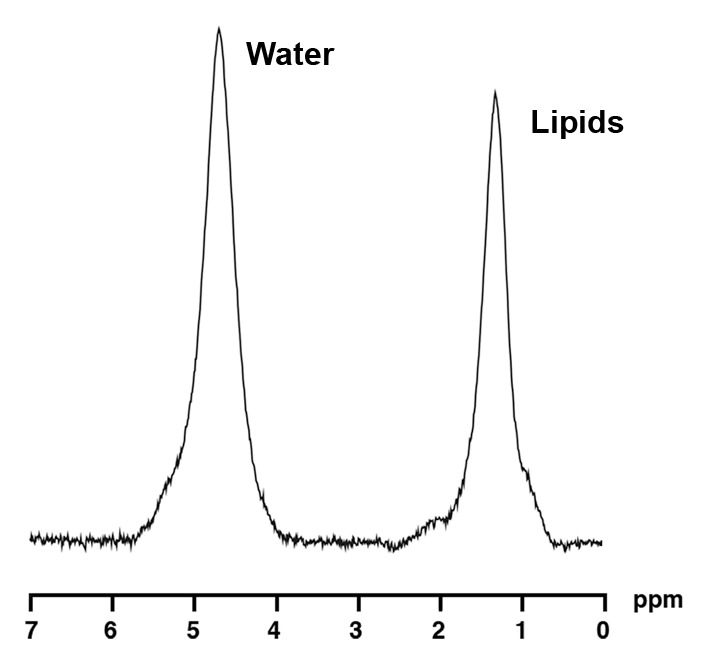
1H MR spectroscopy of liver and bone marrow in a 35-year-old obese man (BMI, 37.4 kg/m2) with high IHL content. For purposes of visual comparison, the amplitude of unsuppressed water in Figures 2 and 3 were scaled identically. (a) 1H MR spectrum of liver shows lipid (1.3 ppm) and unsuppressed water (4.7 ppm) resonances. (b) 1H MR spectrum of bone marrow at L4 shows lipid (1.3 ppm) and unsuppressed water (4.7 ppm) resonances.