
Figure 5:
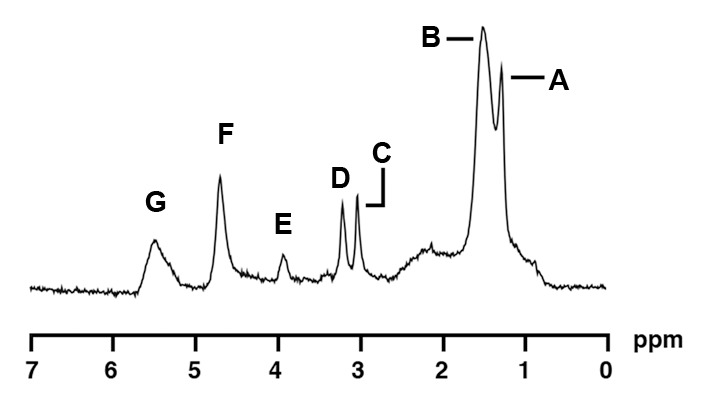
1H MR spectroscopy of soleus muscle in a 34-year-old obese woman (BMI, 38.0 kg/m2) with low IMCL content. Despite similar age and BMI, this obese woman had lower bone marrow fat content (0.33 vs 1.06 lipid-water ratio). 1H MR spectrum of soleus muscle shows the following metabolite peaks: A, IMCL methylene protons (−CH2) at 1.3 ppm; B, extramyocellular lipid methylene protons (−CH2) at 1.5 ppm; C, total creatine (−CH3) resonance at 3.0 ppm; D, trimethylamines peak at 3.2 ppm; E, creatine (−CH2) resonance at 3.96 ppm; F, residual water peak at 4.7 ppm; and G, olefinic proton (HC=CH) resonances at 5.3–5.5 ppm.