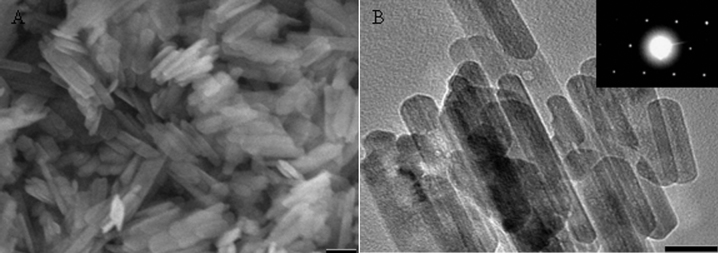
Figure 1. Electron microscopy of iron oxide particles.

(A) SEM and (B) TEM micrographs of iron oxide particles (inset in (B): SAED pattern of iron oxide particle). The scale bars are (A) 100 nm, and (B) 50 nm.

(A) SEM and (B) TEM micrographs of iron oxide particles (inset in (B): SAED pattern of iron oxide particle). The scale bars are (A) 100 nm, and (B) 50 nm.