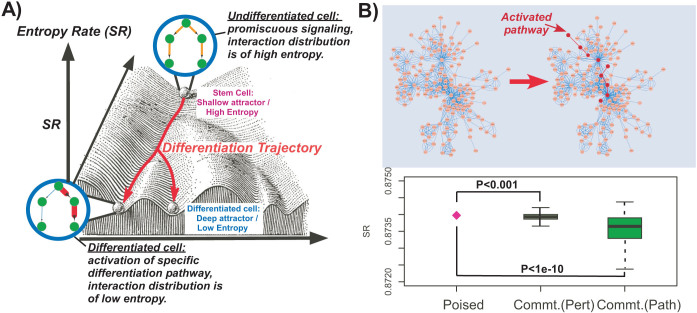
Figure 1. Network entropy as the energy potential in Waddington's landscape.
(A) Illustration of network entropy's role in cellular differentiation. The z-axis represents the network entropy rate (SR) of a cell, which is a measure of the promiscuity/redundancy in the signaling patterns within the cell. The two-dimensional plane spanned by the x-and-y axis represents gene expression state/phase space. We model a cell in a pluripotent stem-cell like state as being in a corresponding shallow attractor in phase space, characterised by increased signaling promiscuity (high network entropy), thus allowing each cell in the population to explore more freely the underlying phase space, resulting in a high cellular diversity. In contrast, a terminally differentiated cell is defined by activation of specific signaling pathway(s), corresponding to less uncertainty in how signals flow in the network (a state of low entropy). Cells in this state are in deep attractors and cellular diversity at the population level is low. (B) Simulation of pathway activation in a realistic protein interaction network (only a small subnetwork is shown). In the left, edge weights are defined equally, so that the random walk on the network is unbiased. On the right, a specific pathway is activated by increasing the relative weights of edges connecting the genes in the pathway (shown in dark red). Lower panel compares the entropy rate (SR) of the unbiased state, representing a highly promiscuous poised cellular state (magenta diamond), to the entropy rates obtained by separately activating each individual gene in the network (> 1000 perturbations, “Commt(Pert.)”), and to the entropy rates obtained by activating whole signal transduction pathways (100 pathways, “Commt.(Path)”). Binomial test P-values are given.

