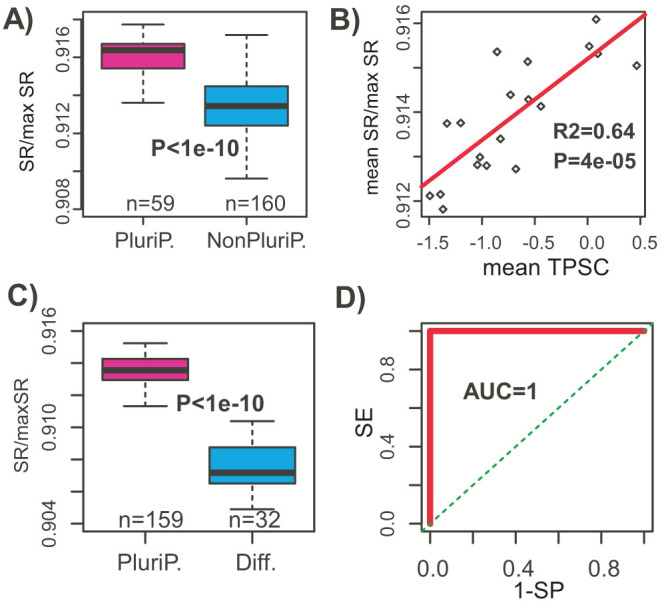
Figure 2. Network entropy correlates with pluripotency.

(A) Normalised entropy rates (SR/maxSR, y-axis) between the 59 pluripotent and 160 non-pluripotent cell-lines from the SCM compendium (219 samples). P-value is from a Wilcoxon rank sum test. (B) Scatterplot of the entropy rate vs pluripotency score, where values for replicates of each cell type have been averaged. Linear regression P-value and R2 value are given. (C) Normalised entropy rates (SR/maxSR, y-axis) between the 159 pluripotent and 32 differentiated samples from the SCM2. P-value is from a Wilcoxon rank sum test. (D) Corresponding ROC curve plus AUC of network entropy discriminating pluripotent from differentiated cells.
