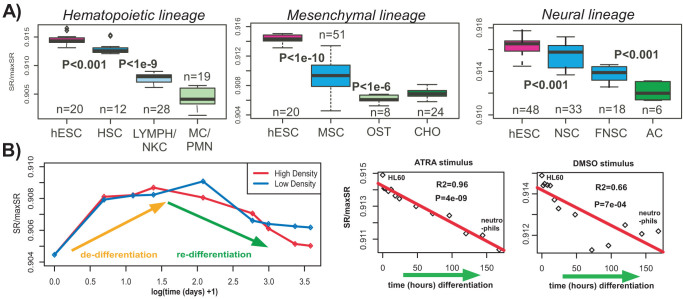
Figure 3. Network entropy marks differentiation potential.
(A) Multi-lineage analysis: Left panel: Comparison of normalised network entropy values of hESCs, hematopoietic stem cells (HSCs), T & B-cell lymphocytes plus natural killer cells (LYMPH/NKC), and monocytes plus neutrophils (MC/PMN). Middle panel: Comparison of normalised network entropy values of hESCs, mesenchyma stem cells (MSCs) and differentiated osteoblasts (OST) and chondrocytes (CHO). Right panel: Comparison of normalised network entropy values of hESCs, neural stem cells (NSCs) derived from the hESCs, fetal neural stem cells (FNSC) and primary astrocytes (AC), as derived from the SCM compendium (Illumina arrays). Wilcoxon rank sum test P-values between consecutive groups in the differentiation hierarchy are given. (B) Dynamic changes in network entropy: Left panel: Network entropy changes in a time course de-differentiation and re-differentiation experiment of retinal pigment epithelium (RPE), with cell density indicating the initial plating density of RPE cells. Right panels: Network entropy rate (SR/maxSR, y-axis) changes of HL60 leukemic progenitor cells against time from initial stimulus with either ATRA or DMSO. The data points on the left indicate the less differentiated HL60 cells, whereas the ones on the far right represent differentiated neutrophils. We provide the R2 values and associated P-values from a linear regression.

