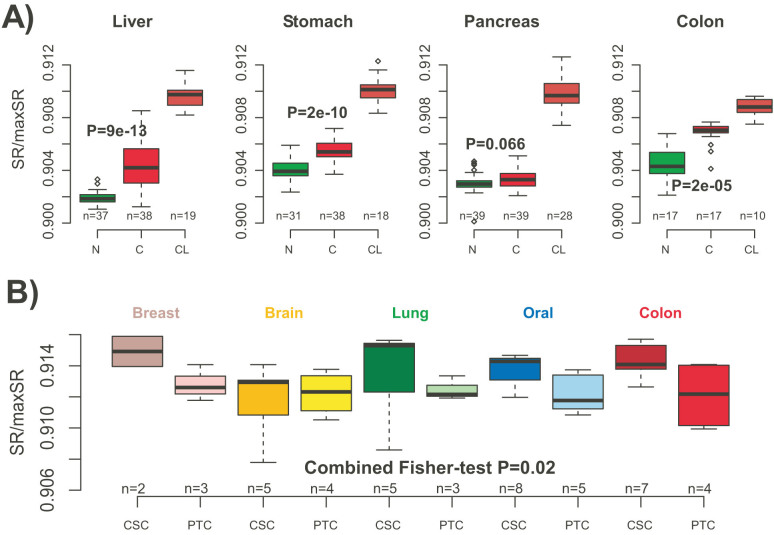
Figure 4. Network entropy discriminates cancer stem cells, cancer and normal tissue.
(A) Comparison of normalised entropy rates (SR/maxSR) between normal and cancer tissue, as well as cancer cell lines, across four different tissue types, as indicated. (B) Comparison of normalised entropy rates between putative cancer stem cells (CSC) and their parental tumour cell lines (PTC) for five different tissue types. Combined Fisher t-test P-value is given.

