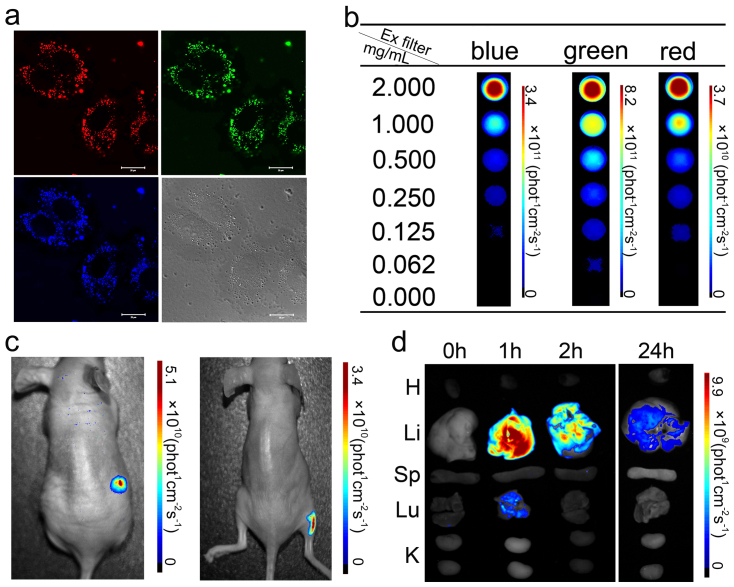
Figure 4.
(a) In vitro cellular imaging of PDs. MCF-7 cells were treated with PDs for 4 h and then imaged with excitation wavelengths of 405, 488 and 543 nm. The scale bar is 20 μm. (b) Fluorescence images of PDs as a function of concentration using a Maestro in vivo imaging system with different excitation filters (blue: 435–480 nm; green: 503–548 nm; red: 616–661 nm). Ex filter: excitation filter. (c) In vivo fluorescence image of PDs (20 μl of 2 mg/mL) injected into mice subcutaneously (left) and intramuscularly (right). (d) Fluorescence images showing the ex-vivo biodistribution of PDs in organs collected from the animals at the time points shown after intravenous injection. Li, liver; Sp, spleen; K, kidney; H, heart; Lu, lung.

