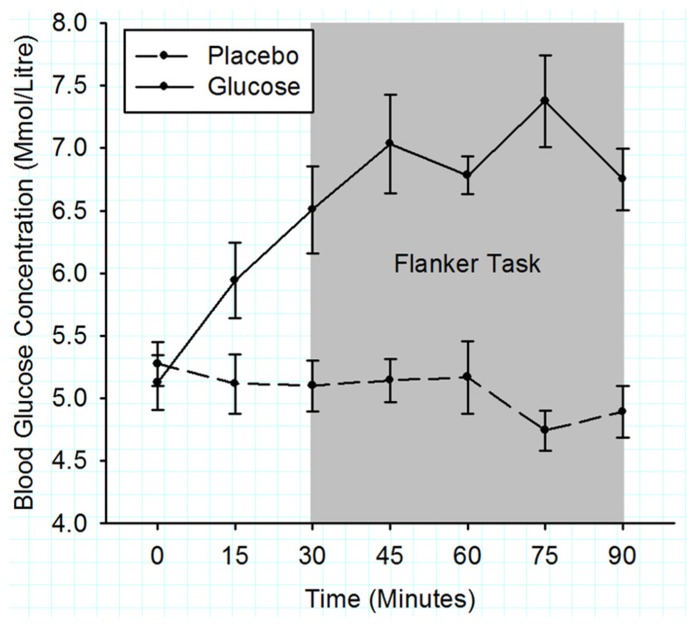
FIGURE 2.
Mean blood glucose concentrations measured in 15 min intervals for the duration of experiment 1. Solid lines represent the BGC in the glucose condition and dashed lines the BGC in the placebo condition. The gray shaded area indicates the time period when the flanker task was performed. Error bars represent the standard error of the mean.

