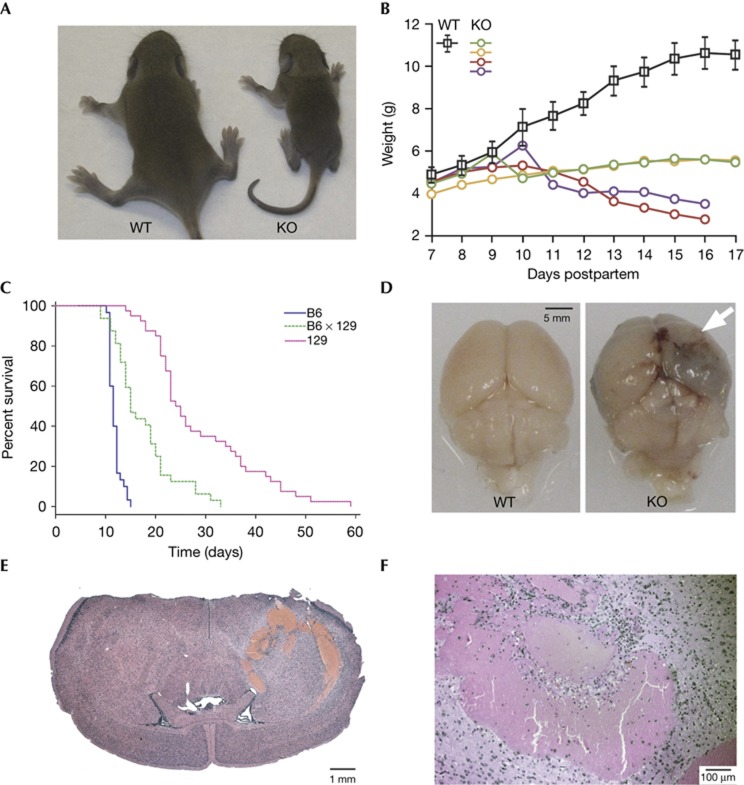
Figure 1.
Phenotype of iRhom1 KO mice. (A) Photograph of 11 day-old WT versus iRhom1 KO pups from a mixed C57/B6J x 129S6/SvEvTac background. (B) Growth curve of WT versus iRhom1 KO pups from a mixed B6/129 background. The WT curve represents mean weight +/− s.d. of seven WT or heterozygous animals, compared with four individual KO littermates. (C) Kaplan–Meier survival plot of iRhom1 KO animals from pure B6 (blue), mixed B6 × 129 (green) or pure 129 (red) background. (D) Photograph of brains from 129 mice illustrating an intracerebral haemorrhage in the KO animals. The site of haemorrhage is indicated by an arrow. (E,F) H&E-stained brain sections from an iRhom1 KO mouse ( × 5, × 50 magnification). H&E, haematoxylin and eosin; KO, knockout, WT, wild type.

