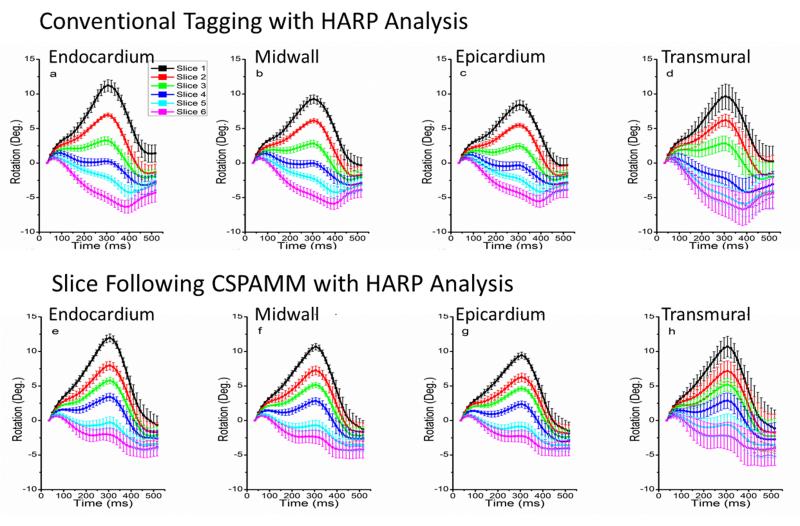
Fig. 3.
Graphs of LV regional rotation using conventional tagging (row 1) and SF-HARP tagging methods (row2). Average rotation for endocardial (a&e), mid-wall (b&f), epicardial (c&g) layers, and average of all three layers (d&h) are presented. Slice 1 represents the most apical slice where-as slice 6 is the most basal slice. Error bars denote the standard deviation within the volunteer population.

