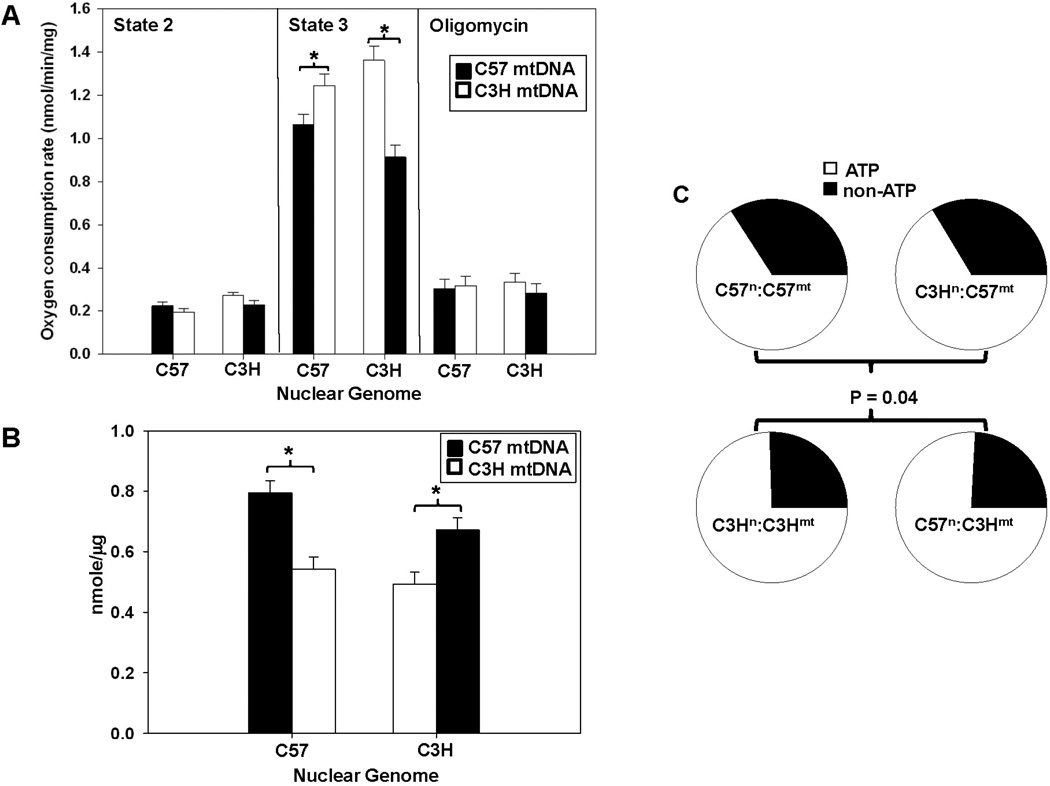
Figure 1. Mitochondrial function and utilization segregates with mitochondrial haplotype.
Respiration and ATP levels were determined in mitochondria isolated from control (C57n:C57mt and C3Hn:C3Hmt) and MNX (C57n:C3Hmt and C3Hn:C57mt) mice (N ≥ 5 per group). For the bar graphs, the nuclear genome for each group is indicated on the X-axis, whereas the filled or open bars indicate the presence of either the C57 mtDNA or C3H mtDNA, respectively. (A) Respiration under state 2 (glutamate/malate), state 3 (glutamate/malate + ADP), and induced state 4 (glutamate/malate + ADP, followed by oligomycin addition). An asterisk (*) indicates a significant difference (p < 0.05) exists compared to nuclear genome matched control. (B) ATP levels determined under state 3 respiration conditions. An asterisk (*) indicates a significant difference (p < 0.05) exists compared to nuclear genome matched control. (C) Pie charts illustrating oxygen utilization profiles (percent oxygen consumption for ATP or non-ATP purposes) for controls (C57n:C57mt and C3Hn:C3Hmt) and MNX (C57n:C3Hmt and C3Hn:C57mt) mice determined in heart mitochondrial isolates. Percent oxygen utilization for ATP production was determined by: ATP = (State 3 – Oligomycin)/State 3, whereas the proportion of oxygen utilized for non-ATP purposes was calculated by non-ATP = Oligomycin/State 3. The pie charts show that overall oxygen utilization was significantly influenced by the mtDNA (P = 0.04).

