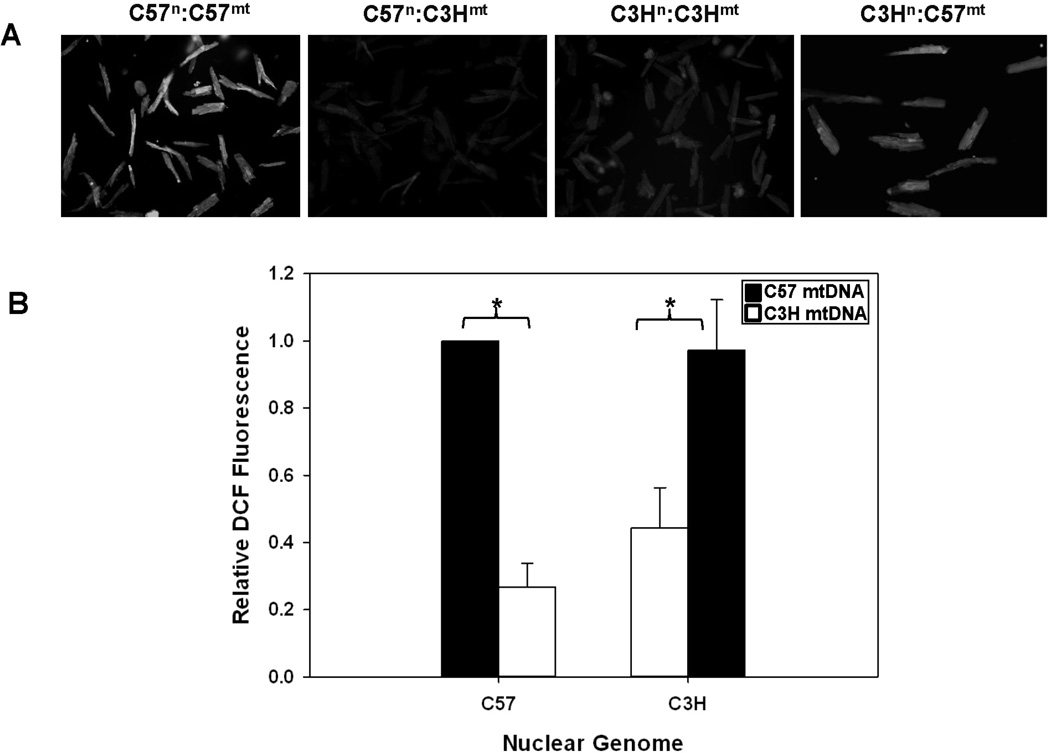
Figure 3. Cellular ROS generation is influenced by the mtDNA in cardiomyocytes.
A) Cardiomyocytes isolated from control (C57n:C57mt and C3Hn:C3Hmt) and MNX (C57n:C3Hmt and C3Hn:C57mt) mouse hearts were treated with DCF-DA and cellular fluorescence measured (485 nm/530 nm - excitation/emission) B) Bar graph illustrating fluorescence relative to the C57n:C57mt controls. The nuclear genome for each group is indicated on the X-axis, whereas the filled or open bars indicate the presence of either the C57 mtDNA or C3H mtDNA, respectively. Data = mean ± SEM from 35–50 cardiomyocytes. An asterisk (*) indicates a significant difference (p < 0.001) exists compared to nuclear genome matched control.

