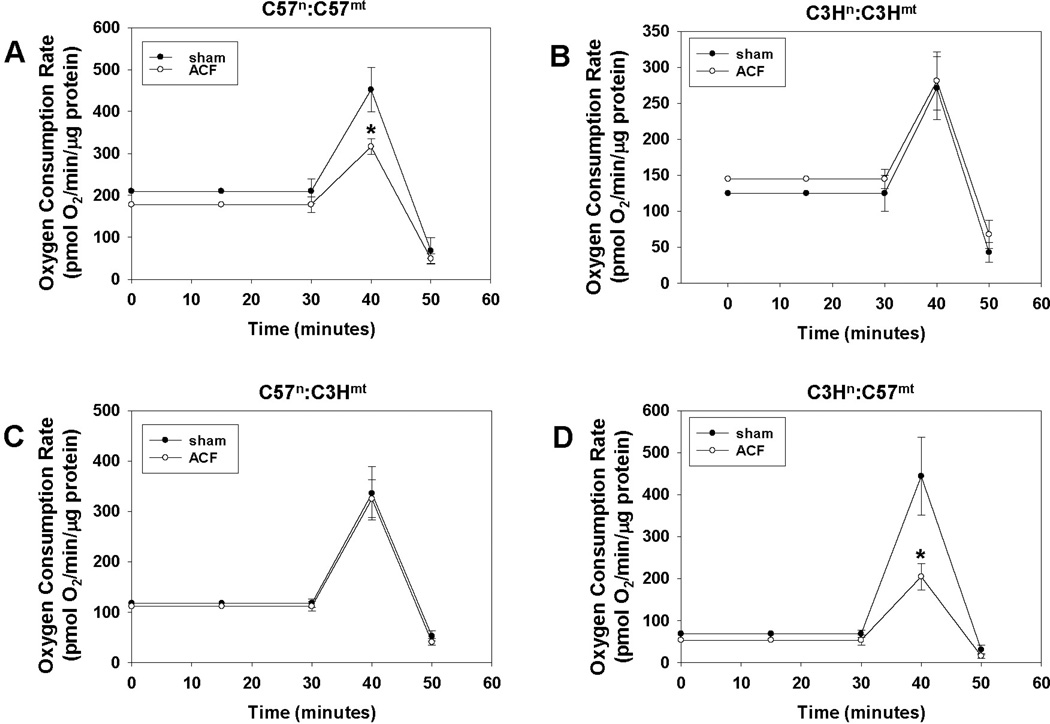
Figure 6. Cardiomyocyte bioenergetics in sham and aortacaval fistula (ACF) treated hearts.
Graphs illustrating basal, maximum, and non-mitochondrial oxygen consumption rates in cardiomyocytes isolated from sham and ACF treated hearts for (A) C57n:C57mt(B) C3Hn:C3Hmt(C) C57n:C3Hmtand (D) C3Hn:C57mt (see methods, N > 5 per group). Asterisks (*) indicate a significant (P < 0.05) difference exists between ACF and sham treated control.

