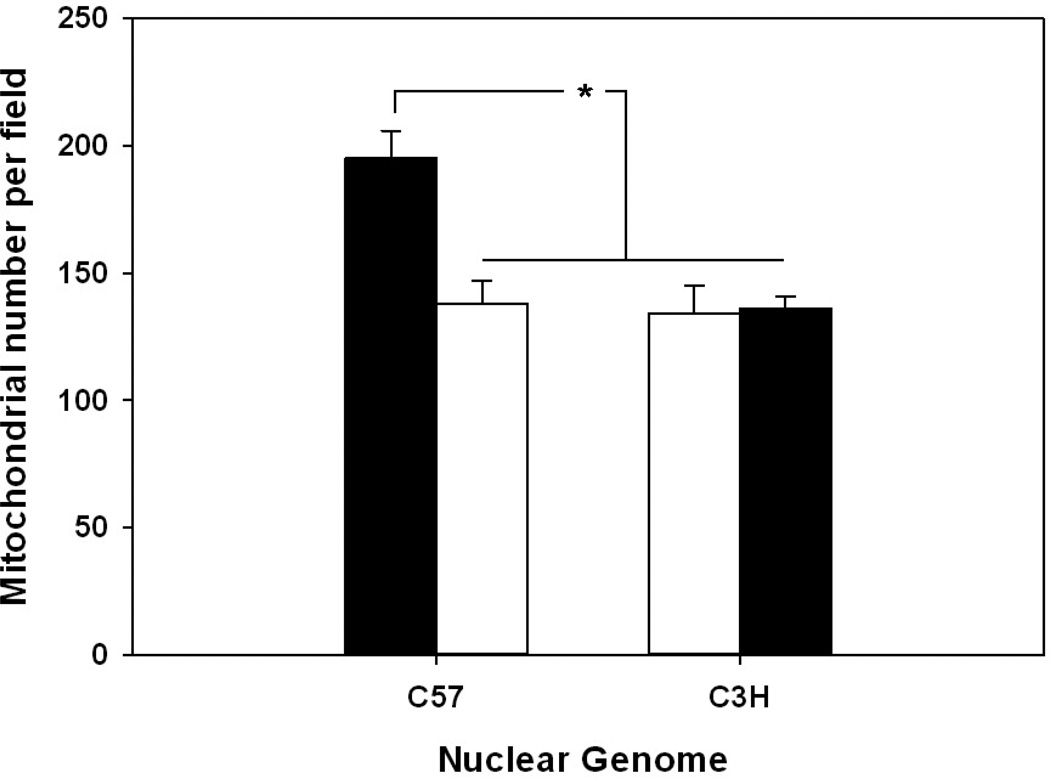
Figure 7. Average number of mitochondria in left ventricular tissue in control and MNX mice.
Graph illustrating mean number of mitochondria per TEM field from control (C57n:C57mt and C3Hn:C3Hmt) and MNX (C57n:C3Hmtand C3Hn:C57mt) mice. Values were calculated from a total of 78 fields with a minimum of 8 fields per mouse strain. Asterisks (*) indicate a significant (P < 0.05) difference exists between C57n:C57mt versus C3Hn:C3HmtC57n:C3Hmt and C3Hn:C57mt left ventricular tissue.

