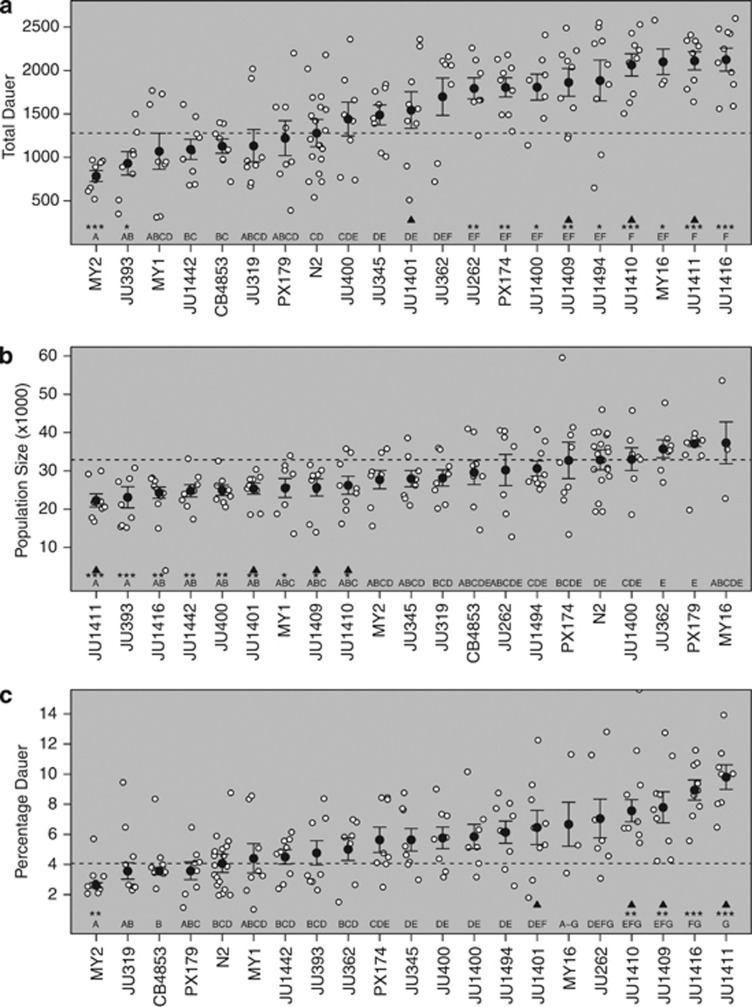
Figure 1.
Natural variation in growing populations. The number of dauer larvae (a), the population size (b) and the percentage dauer larvae (c) at food exhaustion for N2 and 20 wild isolates. Dotted black horizontal lines show mean N2 values. Means per line are shown by the solid circle. Error bars indicate standard errors. Significance is shown by the asterisks on the x axis (*P<0.05, **P<0.01, ***P<0.001), denoting isolates that differ from N2. The letters show the significantly different groups. Black triangles show isolates identified as a clonal set by Andersen et al. (2012).

