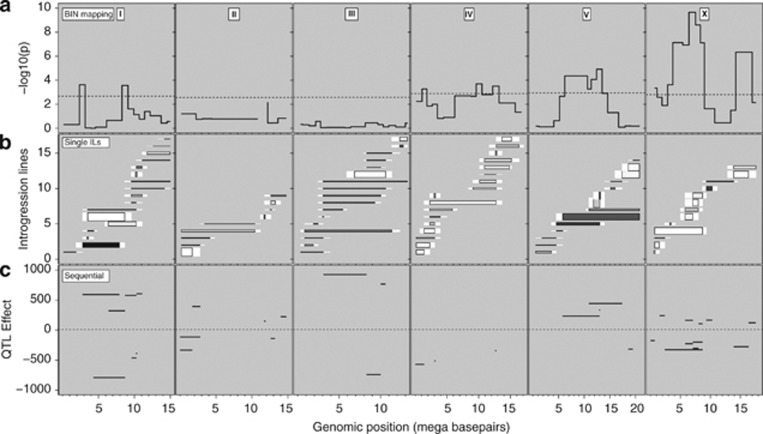
Figure 2.
Three strategies for mapping QTLs affecting dauer larvae development. Chromosomes are indicated by the Roman numeral at the top of the panels. (a) Bin mapping, with chromosome-specific threshold (false discovery rate=0.05) indicated by the horizontal line and significance (−log 10 (P)) per marker is shown in black. (b) Single IL analysis, with ILs shown as horizontal bars. The length indicates the introgression size, the colour the CB4856 allelic effect (darker than background is positive and lighter than background is negative) and the width indicates the significance. For exact values and IL names see Supplementary Figure 6. (c) Sequential IL analysis, with QTLs shown by the black horizontal bars. The y axis shows the effect of the CB4856 allele. For exact values, see Supplementary Table 2.

