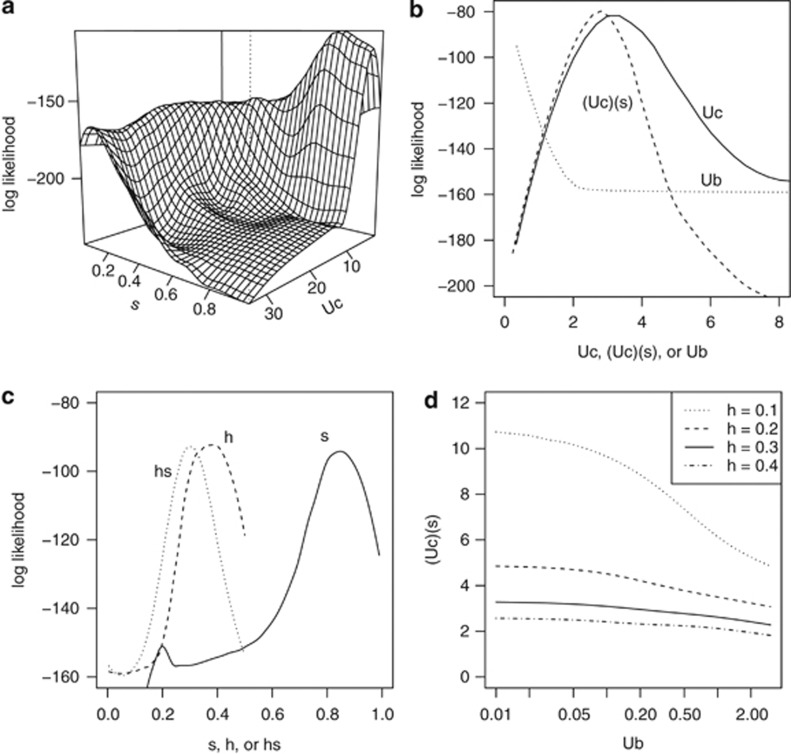
Figure 4.
Maximum-likelihood profiles. (a) Loess-interpolated maximum-likelihood surface of Uc and s from Nelder–Mead-assisted, random grid search. (b) Likelihood profiles for number of canopy mutations Uc, number of background mutations Ub, and the product of Uc and s, the homozygous loss in fitness. (c) Likelihood profiles of the homozygous loss in fitness s, the dominance coefficient h, and hs, the heterozygous loss in fitness. (d) The maximum-likelihood estimate of the product of Uc and s for the indicated values of h and Ub.

