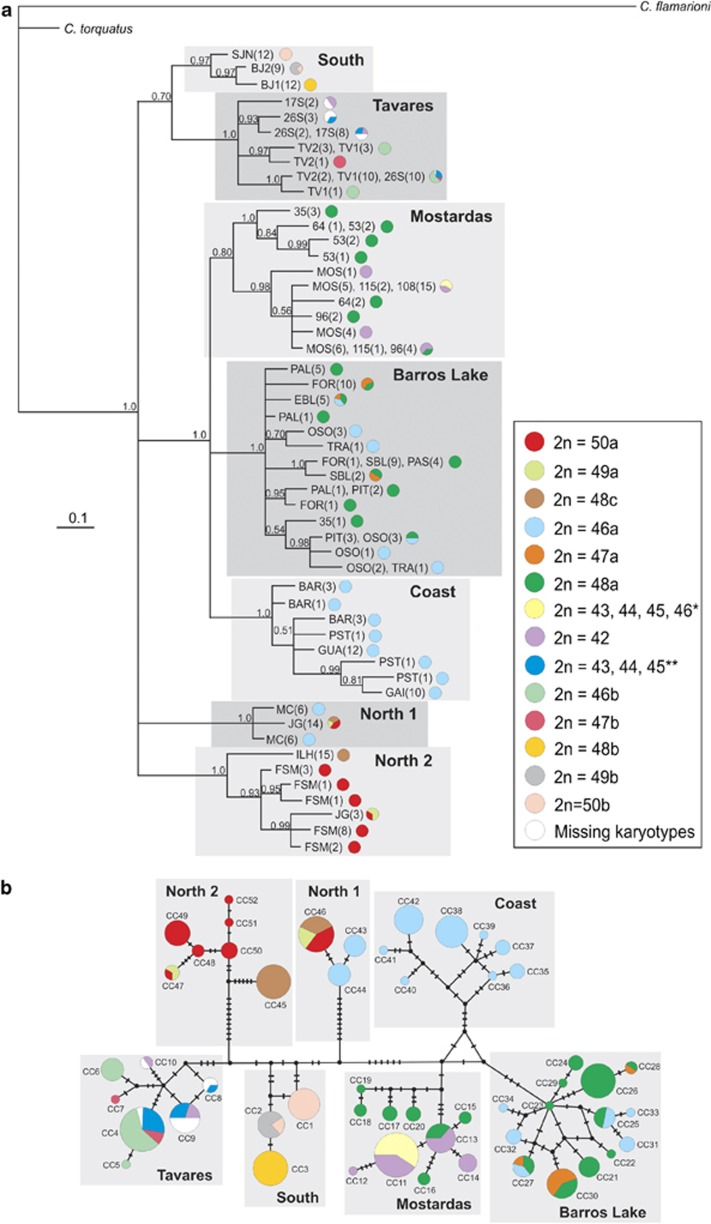
Figure 3.
(a) Bayesian phylogenetic tree; and (b) median-joining haplotype network topology obtained for concatenated mtDNA data. The seven main genetic haplogroups are highlighted by squares. Shading represents diploid numbers of parental karyotypes and intraspecific hybrids, as indicated in the legend. The abbreviations of the localities and the number of specimens per sampling site (within parentheses) are shown in the tree, and correspond to those in Table 1. The node posterior probabilities are given on the branches. Small black circles represent extinct or unsampled haplotypes in the network topology, and circle areas are proportional to the haplotype frequencies. *Diploid numbers of hybrids from crossing between 2n=42 × 48a; **diploid numbers of hybrids from crossing between 2n=42 × 46b. The color reproduction of this figure is available on the Hereditary journal online.

