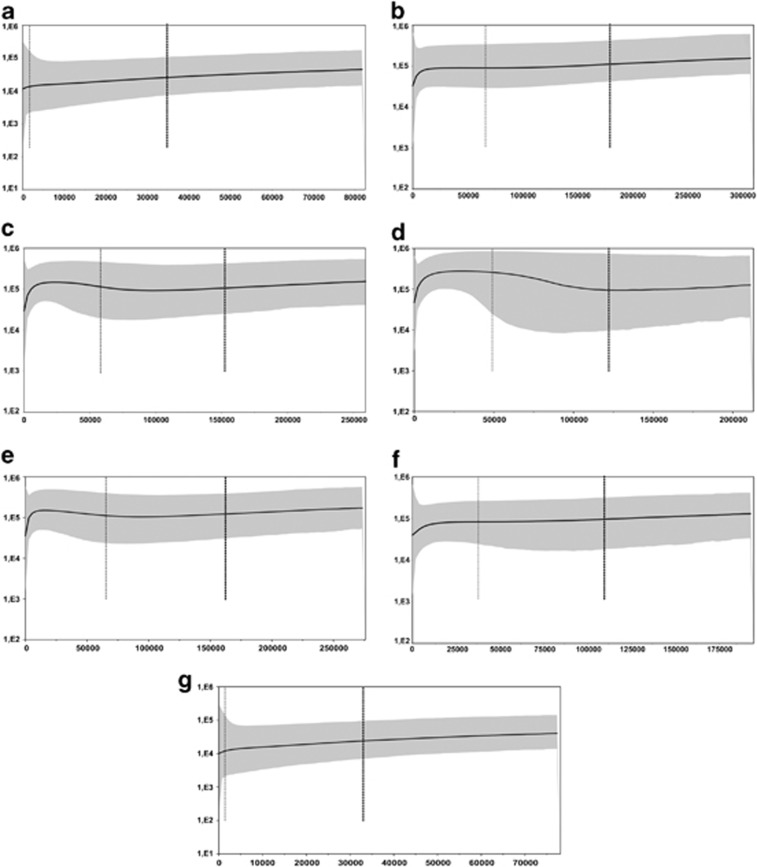
Figure 4.
Bayesian skyline plots of concatenated mtDNA data for the seven main haplogroups of C. minutus: (a) North 1; (b) North 2; (c) Coast; (d) Barros Lake; (e) Mostardas; (f) Tavares; and (g) South. The gray area corresponds to the 95% highest posterior density limits for the effective population size. The thin and thick dotted lines are the lowest and the mean estimated tMRCA. Below the plot is the time represented in years, and in the left side are the effective population sizes.

