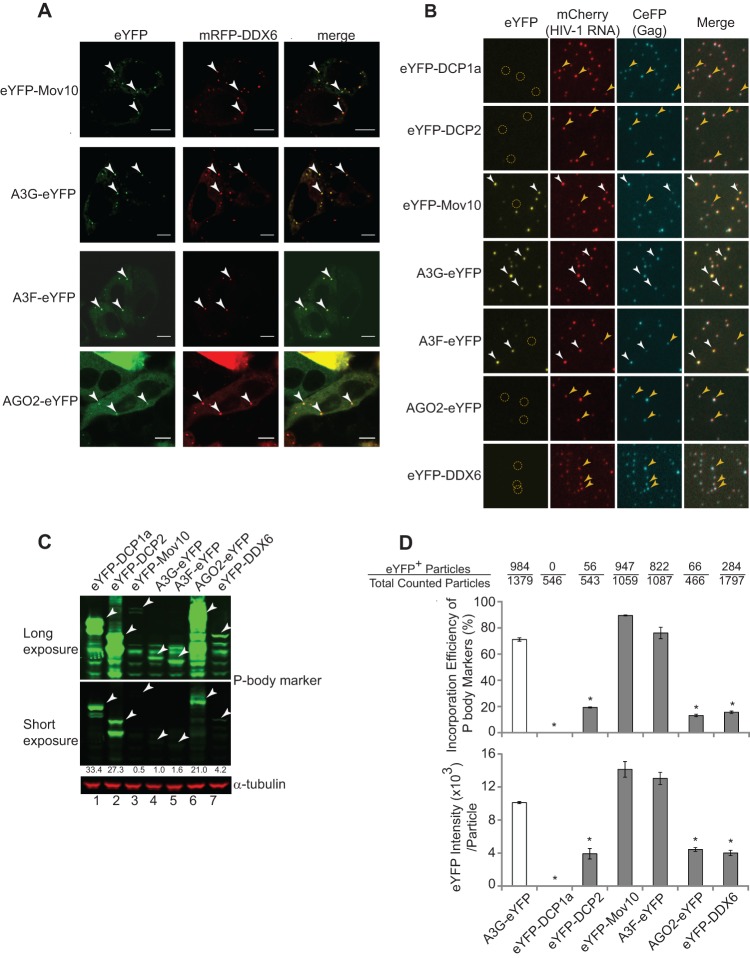
Fig 1.
P-body localization and virion incorporation of Mov10, A3G, A3F, and AGO2. (A) Colocalization of eYFP-Mov10, A3G-eYFP, A3F-eYFP, and AGO2-eYFP with P-body marker protein mRFP-DDX6 was determined in cotransfected HeLa cells. Live cells were visualized at 16 h posttransfection using laser-scanning confocal microscopy. Examples of P bodies showing colocalization of eYFP and mRFP signals are labeled with white arrowheads. Scale bars, 10 μm. (B) Single-virion analysis of eYFP-tagged P-body marker proteins, DCP1a, DCP2, Mov10, A3G, A3F, AGO2, and DDX6. Representative images of virus particles labeled with Gag (CeFP) and HIV-1 RNA (mCherry) are shown. The white arrowheads indicate virus particles containing eYFP signals. The yellow circles and arrowheads indicate virus particles that do not contain eYFP signals. (C) Immunoblotting analysis of cellular expression levels of eYFP-tagged proteins in virus producer cells. Total cell lysates were analyzed using an anti-GFP antibody, and the intensities of bands of the expected size were quantified using the Odyssey system. The amount of protein loaded was normalized using the α-tubulin amounts. (D) Virion incorporation of eYFP-tagged P-body proteins. Packaging efficiency was calculated by determining the percentage of CeFP+ (Gag) plus mCherry+ (HIV-1 RNA) particles that contained the eYFP signal (eYFP-tagged P-body proteins) (top). The average integral intensity per virus particle (CFP+ and mCherry+) was calculated for eYFP (bottom). The number of eYFP+ virus particles and the total particle numbers counted are shown above each sample. The error bars represent the standard deviations for two independent experiments. The asterisks indicate statistically significant decreases compared to A3G-eYFP (white bars; *, P < 0.05; t test).

