Fig 5.
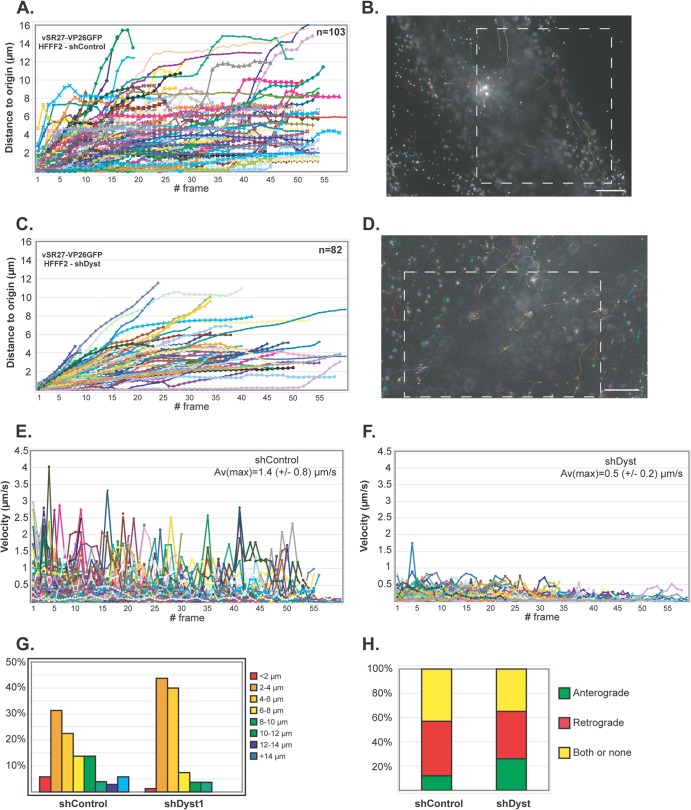
Impact of dystonin reduction on capsid transport during entry. shControl (A, B, and E) or shDyst (C, D, and F) HFFF2 cells were infected with 50 PFU/cell of vSR27-VP26GFP. Starting at 45 min after infection, cytoplasmic capsid movements were monitored by live-cell imaging at a rate of one frame per second. Results for each individual capsid tracked are plotted as the distance to the origin (A and C) or as the velocity (E and F) for each frame. The premature truncation of some lines is due to the capsids moving out of the field of view. A representative cell with all capsid trajectories plotted is shown for each condition (B and D). Dashed boxes, the area displayed in the corresponding movies (see Movies S1 and S2 in the supplemental material, respectively). Bars, 10 μm. (G) Summary of the maximum distances to the origin taken from the data shown in panels A and C as percentages of cells in categories of the distance to the origin. (H) Every moving capsid was tracked individually, and its directionality was estimated according to the position of the nucleus. Results are shown as the percentage of capsids having overall retrograde (away from the cell periphery and toward the nucleus) or anterograde (away from the nucleus and toward the cell periphery) motion. Both or none, either a capsid having opposite directionalities within the same run, a capsid that was not moving, or a capsid where the direction of movement relative to the nucleus could not be categorized.

