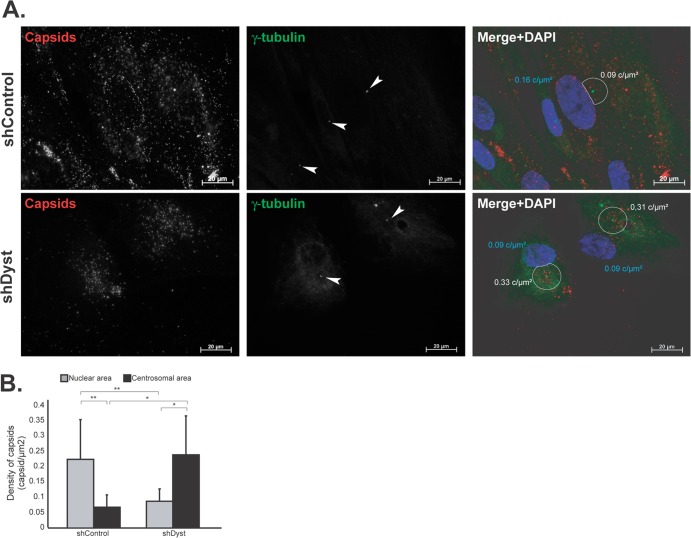
Fig 6.
Effect of dystonin silencing on capsid localization during entry. ShControl or shDyst HFFF2 cells were infected with 25 PFU/cell of WT HSV-1 for 3 h at 37°C in the presence of 100 μg/ml cycloheximide before being fixed. (A) Capsids were visualized with the rabbit anticapsid antibody PTNC and GAR568 (red), and centrosomes were visualized with MAb GTU-88 against gamma-tubulin and GAM488 (green). Nuclei were visualized with DAPI (blue). z-stacks of the whole-cell thickness were collected and are shown here in projection. Arrowheads, centrosomes; white circles, an area of 9 μm2 centered on the centrosome excluding any overlapping nuclear area. The density of capsids (in number of capsids per μm2 of surface [c/μm2]; see below) in each circle is specified. (B) Nuclear capsids (defined as capsids present within the DAPI-labeled area) and centrosomal capsids (defined as capsids present within the area delineated by the white circles) were counted. A total of 2,102 capsids were counted in 19 shControl cells and 1,083 capsids were counted in 11 shDyst cells. The nuclear and centrosomal surface areas were calculated using Zeiss Axiovision software, and the number of capsids per μm2 of surface (capsid density) was calculated. Asterisks indicate statistical differences (t test; *, P < 0.01; **, P = 0.001).

