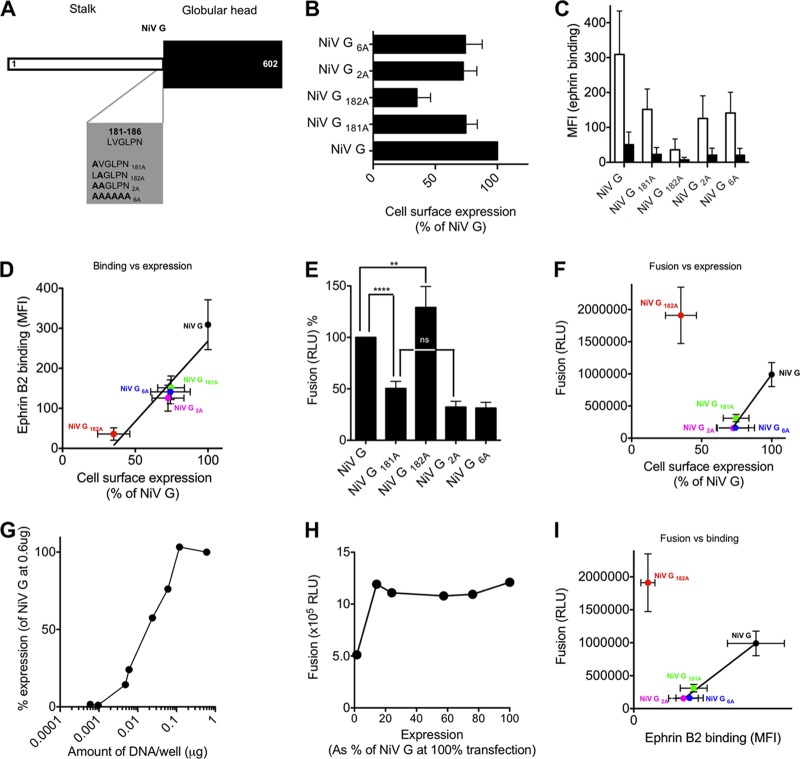
Fig 10.
Requirement for specific residues at residues 181 and 182 of the NiV G stalk for binding and fusion promoting activity of NiV G. (A) Schematic diagram of alanine scanning mutagenesis of NiV G constructs. (B) FACS analysis of cell surface expression from cells transfected with the chimeric proteins shown in panel A. The results are presented as percentages of NiV G cell surface expression. (C) Receptor binding activity of the NiV G proteins to ephrin B2 (□) or ephrin B1 (■). (D) Ephrin B2 binding versus cell surface expression. (E) Cell-to-cell fusion mediated by NiV F coexpressed with the NiV G proteins in panel A. Fusion is measured by a β-Gal complementation assay. The values in panels B, C and D are means (± the standard errors) of results from four experiments. (F) Fusion measured by β-Gal complementation assay versus cell surface expression. (G) FACS analysis of cell surface expression from cells transfected with different levels of wt NiV G cDNA. The results are presented as percentages of NiV G cell surface expression at the highest cDNA concentration. (H) Fusion measured by β-Gal complementation under the same cell surface expression. (I) Ephrin B2 binding versus fusion measured by β-Gal complementation assay. **, P < 0.05; ****, P < 0.001 (one-way analysis of variance, Dunn's multiple comparison test).

