Fig 7.
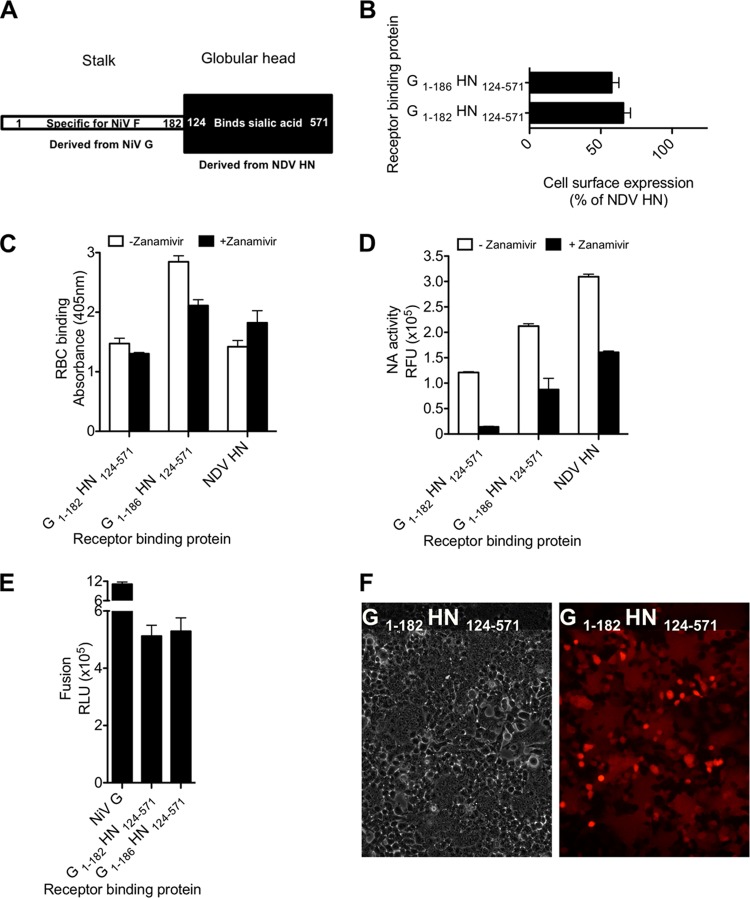
NiV G stalk residues 181 to 182 are sufficient for the activation of NiV F. (A) Schematic diagram of the G1-182-HN124-571 chimeric protein. (B) FACS analysis of cell surface expression from cells transfected with the chimeric proteins shown in Fig. 6A. The results are presented as percentages of NDV HN cell surface expression. (C) Receptor binding in the absence (□) or presence (■) of 2 mM zanamivir. (D) Neuraminidase activity of the receptor binding proteins, expressed in relative fluorescence intensity units (RFU) in the absence (□) or presence (■) of 2 mM zanamivir. The values are means ± the SD of results from samples assessed in triplicate and are representative of the experiment repeated at least three times. (E) Cell-to-cell fusion of the chimeric protein coexpressed with NiV F. Cell-to-cell fusion was measured by a β-Gal complementation assay. The values in panels B, C, D, and E are means (± the standard errors) of results from three experiments. (F) Cell-to-cell fusion promoted by the chimeric protein expressed with NiV F is observed in the left panel by syncytium formation using visible microscopy and in the right panel by redistribution of RFP (red fluorescent protein) using fluorescence microscopy.

