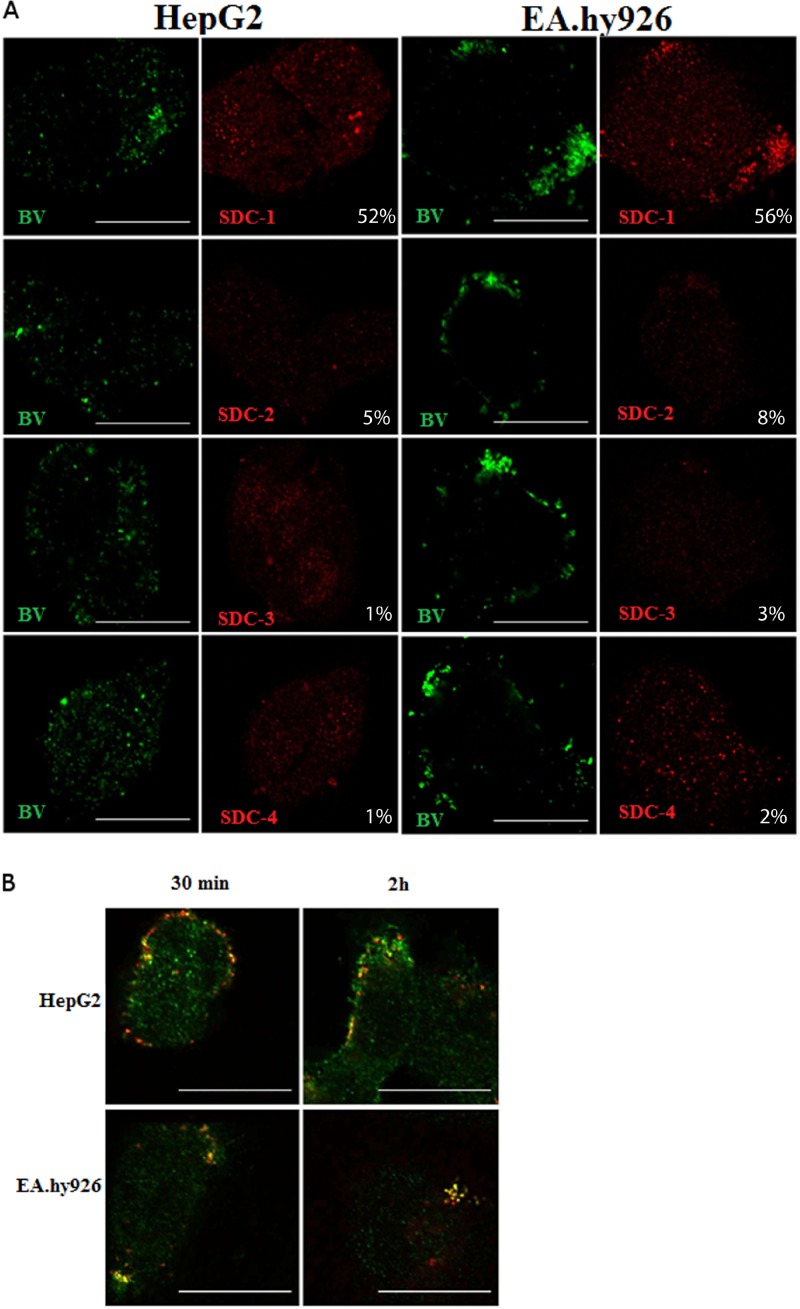
Fig 5.
Localization of baculovirus with different syndecans in EA.hy926 and HepG2 cells. (A) Baculovirus (MOI, 500) was allowed to bind to and enter the cells and was immunostained with mouse anti-vp39 and anti-mouse Alexa 488. Syndecans were stained with rabbit anti-SDC-1 to -4 antibodies and anti-rabbit Alexa 555 antibody. Baculoviruses are seen in green and syndecans in red. Imaging was performed by confocal microscopy (60× magnification). Colocalization percentages represent the percent overlap of baculovirus with SDC-1 to -4 signals. Scale bars, 20 μm. (B) SDC-1 and baculovirus colocalization at different time points (30 min and 2 h) postinternalization in HepG2 and EA.hy926 cells. Baculovirus (MOI, 500) was allowed to bind to and enter the cells, and the virus was immunostained with mouse anti-vp39 and anti-mouse Alexa 555. SDC-1 was stained with rabbit anti-SDC-1 antibody and anti-rabbit Alexa 488 antibody. SDC-1 is seen in green, and baculoviruses are seen in red. Imaging was performed by confocal microscopy (60× magnification). Scale bars, 20 μm.

