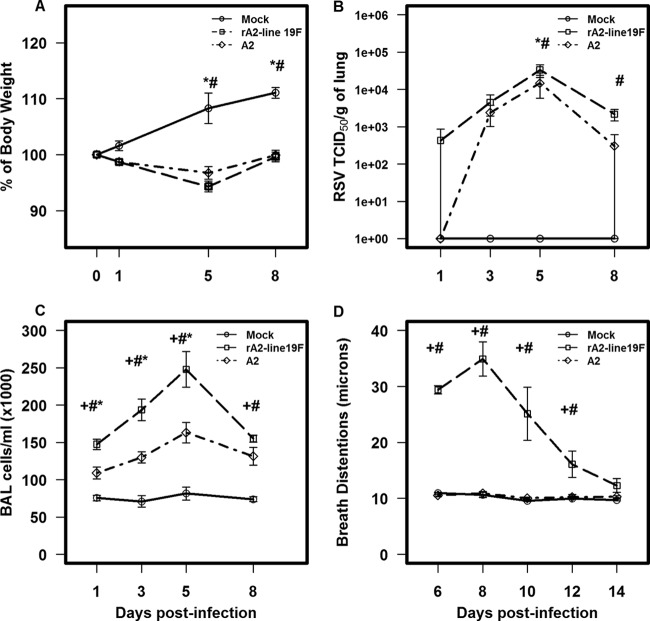
Fig 2.
Comparisons of challenges with two RSV strains, rA2-line19F and A2, on weight loss (n = 10 mice/group) (A), viral load (n = 3 mice/group) (B), pulmonary inflammation (n = 5 mice/group) (C), and pulsus paradaxus (n = 5 mice/group) (D). BALB/c mice were challenged with 1 × 10⁶ TCID50 of either rA2-line19F or A2. Data points represent means ± SEMs. +, values for rA2-line19F are significantly different (P ≤ 0.001; ANOVA) from those for A2; #, values for rA2-line19F are significantly different (P ≤ 0.001; ANOVA) from those for mock infections; *, values forA2 are significantly different (P ≤ 0.001; ANOVA) from those for mock infections.

