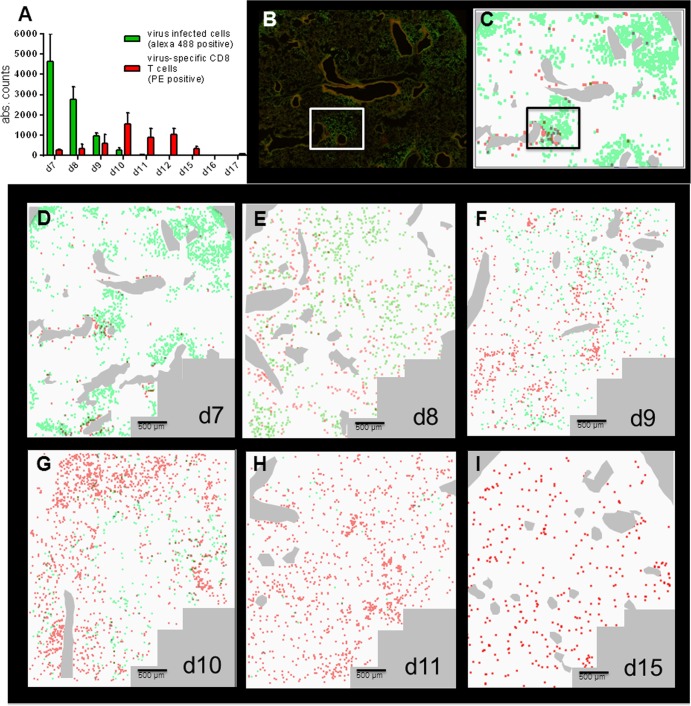
Fig 4.
ScanR microscopy used for a detailed analysis of virus infection and the resulting T cell response. P14 chimeric mice were infected with 100 to 200 PFU of rPVM-GFPgp33 (d0). At the indicated time points, lung sections were stained for PVM-infected cells (green signal) and Thy1.1-positive CTL (red signal) and images were taken at a 20-fold magnification. Gallery views were generated from 84 individual images covering a lung area of 12 mm2 as described in Materials and Methods. Images from 2 to 5 mice per time point obtained in 2 independent experiments produced similar results. (A) Total number of virus-infected cells (green bars) and virus-specific CTL (red bars) as counted by the ScanR analysis software corrected for the number of fields actually containing lung tissue. Bars represent the mean value of 3 to 5 mice per time point, and whiskers represent the standard deviations. (B) Representative example of a gallery view taken at day 7 after infection as an original picture. (C) Gallery view from panel B transformed to a schematic view, where red and green dots were enlarged to a similar size. (D to I) The images show an overlay of the of red and green fluorescence signals obtained by the ScanR analysis after transformation to a schematic view. Large bronchi were stained manually in pale gray. The overlay pictures shown are representative of similar pictures obtained from 2 to 5 mice per time point.

