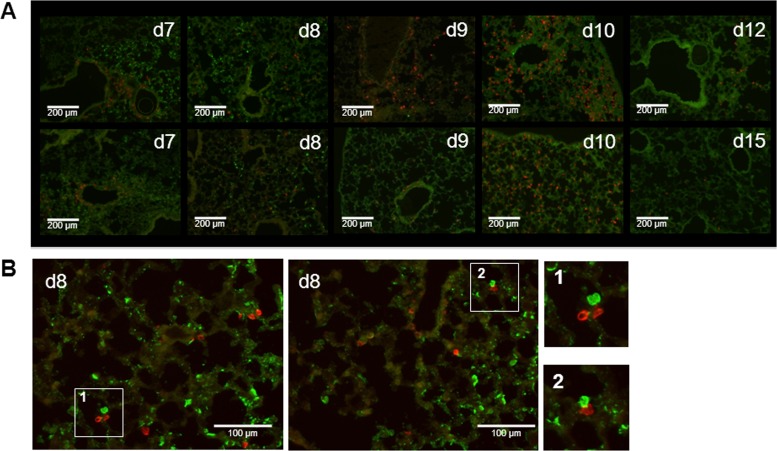
Fig 5.
Coevolution of virus distribution and the antiviral T cell response in the PVM-infected mouse lung. P14 chimeric mice were infected with 100 to 200 PFU of rPVM-GFPgp33, and at the indicated time points, lungs were prepared for histological analysis. Lung sections (12 μm) were stained for PVM (Alexa 488 signal) and Thy-1.1 (PE signal) and images were taken with an Apo Tome fluorescence microscope (10-fold magnification) (A) or ScanR microscope (20-fold magnification) (B). Representative images for different time points after infection are shown. Images 1 and 2 are enlargements of sections illustrating colocalization of intraalveolar virus-specific CTL and virus-infected pulmonary epithelial cells.

