Fig 7.
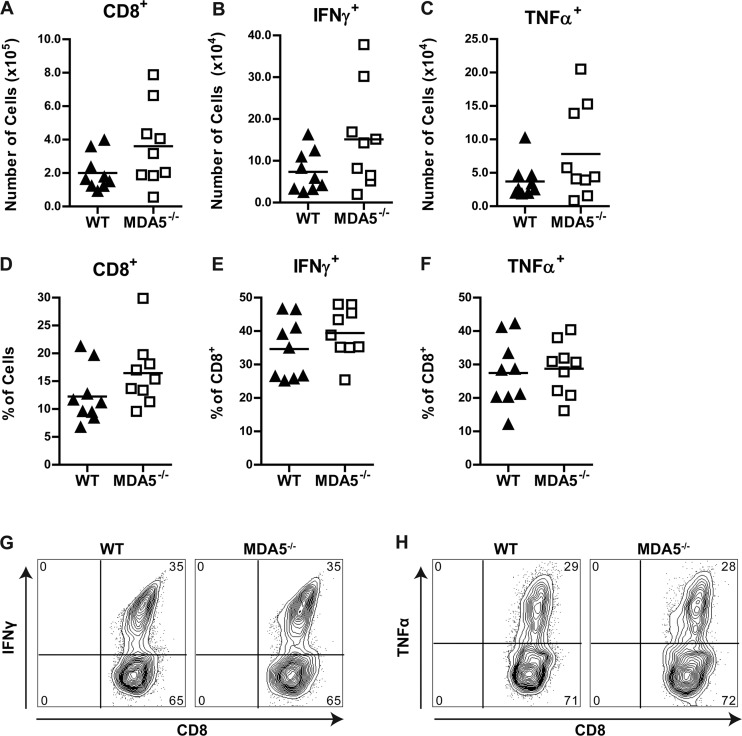
(A to F) Immunophenotyping of brain leukocytes in infected WT and MDA5−/− mice. Mice were infected with 102 PFU of WNV in the footpad. Brains were harvested and analyzed by flow cytometry at 7 days after infection. Numbers (A to C) and percentages (D to F) of the indicated populations are shown; symbols represent individual mice. CD8+, IFN-γ+, and TNF-α+ populations represent cells that were restimulated with an immunodominant WNV NS4B peptide. (G and H) Representative flow cytometry plots of IFN-γ+ and TNF-α+ populations. Numbers indicate the percentage of cells in each quadrant.

