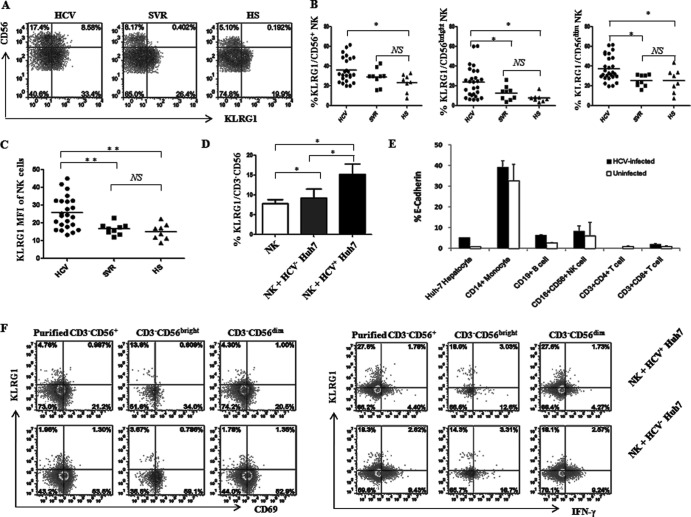
Fig 2.
KLRG1 is upregulated on NK cells by HCV infection. (A) PBMCs from 24 HCV patients, 9 SVR individuals, and 8 HS were analyzed by flow cytometry for expression of KLRG1 on different subsets of NK cells. Representative dot plots showing the gating strategy for KLRG1 expression on total CD3− CD56+ NK cells and CD3− CD56bright and CD3− CD56dim subsets in patients with chronic HCV infection, individuals after treatment with SVR, and HS. Percent cell frequency in the gated area is shown in the dot plots. (B) Summary data showing the percentages of KLRG1 expression in total CD3− CD56+ NK cells and CD3− CD56bright and CD3− CD56dim subsets. Each dot represents one individual, and the horizontal bars represent mean values. *, P < 0.05; NS, no significance. (C) MFI of KLRG1 expression on CD3− CD56+ NK cells. **, P < 0.01; NS, no significance. (D) Upregulation of KLRG1 expression on NK cells incubated with or without HCV-transfected (HCV+) or untransfected (HCV−) Huh-7 hepatocytes. Briefly, healthy PBMCs were cocultured with HCV-transfected or untransfected Huh-7 cells, and KLRG1 expression on CD3− CD56+ NK cells was analyzed by flow cytometry as described in Materials and Methods. Summary data (means ± SD) from three independent experiments are shown. *, P < 0.05; NS, no significance. (E) Expression of the KLRG1 ligand E-cadherin on HCV-infected and uninfected Huh-7 hepatocytes as well as on different populations of PBMCs from 3 HCV-infected and 3 uninfected subjects. The percentage of cells expressing E-cadherin was calculated as the percentage in the sample minus that in the isotype control. (F) Representative dot plots of CD69 expression (left panel) and IFN-γ production (right panel) by KLRG1+ or KLRG1− NKs, including total purified CD3− CD56+ NKs as well as CD56bright and CD56dim subsets, cocultured with HCV+ or HCV− Huh-7 hepatocytes. The percent cell frequency in the gated area is shown in the dot plots.

