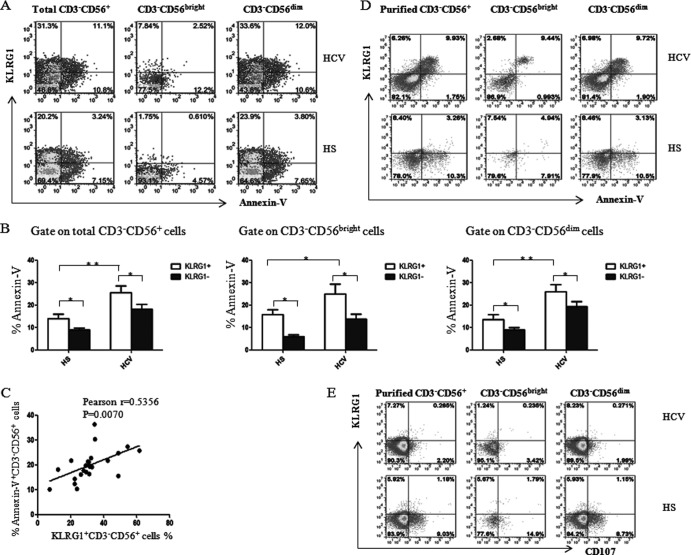
Fig 4.
KLRG1 expression is positively associated with apoptosis of NK cells following HCV infection. (A) PBMCs from HCV-infected patients and HS were stimulated with 10 ng/ml rhIL-12 for 18 h, followed by 1 μg/ml brefeldin A 4 h prior to harvest of the cells (to block cytokine secretion). PBMCs were immunostained and then analyzed for Annexin V expression on total CD3− CD56+ and CD3− CD56bright and CD3− CD56dim NK cells by flow cytometry. Representative dot plots for Annexin V expression on KLRG1+ and KLRG1− NK cells, including CD3− CD56+ and the CD3− CD56bright and CD3− CD56dim subsets from an HCV-infected patient and HS are shown. (B) Average percentage of Annexin V expression from the KLRG1+ versus KLRG1− cell fraction of total CD3− CD56+ NK cells and the CD3− CD56bright and CD3− CD56dim subsets. Results are expressed as means ± SD of the percentages of Annexin V expression by NK cells from 24 HCV-infected patients versus 8 HS. *, P < 0.05; **, P < 0.01. (C) Relationship between KLRG1 expression and Annexin V expression on CD3− CD56+ NK cells from 24 HCV-infected patients, based on Pearson correlation analysis. r = 0.535; **, P < 0.01. (D) Representative dot plots for KLRG1 and Annexin V expressions on negatively selected NK cells, including CD3− CD56+ and the CD3− CD56bright and CD3− CD56dim subsets, from an HCV-infected subject and HS. (E) Representative dot plots for KLRG1 and CD107a expression levels on negatively selected NK cells, including CD3− CD56+ and the CD3− CD56bright and CD3− CD56dim subsets, from an HCV-infected subject and HS. The percentage of cells in the gated area is shown in the dot plots.

