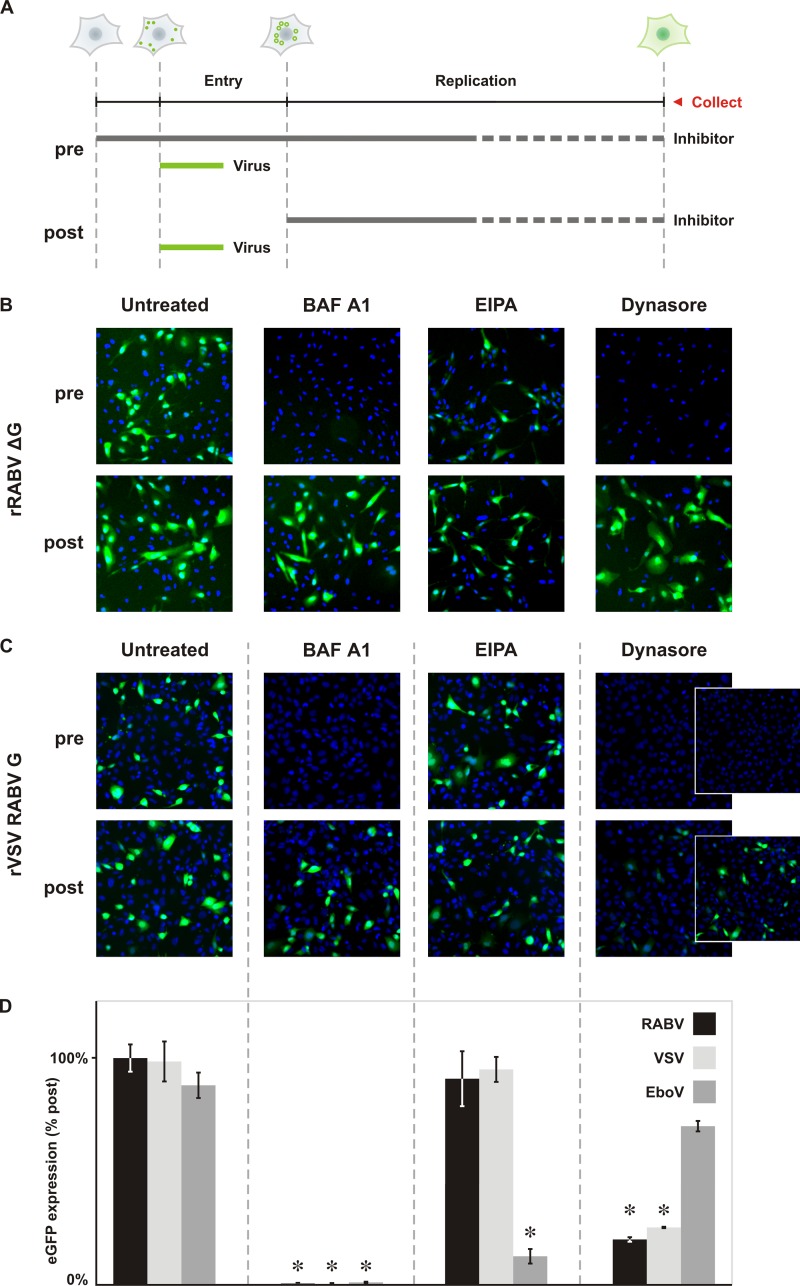
Fig 2.
Dynamin and endosomal acidification are required for productive RABV G-dependent infection. (A) Schematic of the methods employed for panels B and C. A graphical representation of a cell at each time point indicates the stage of infection. Circles represent viral particles, surface bound (filled) or internalized (hollow). Expression of the reporter gene, eGFP, is shown as a diffuse green in the cytoplasm. BS-C-1 cells were inoculated with virus (MOI = 0.5) and assayed for infection by detection of the eGFP reporter gene either by autoscope microscopy or cytofluorimetry at the collection point (25 hpi for rRABV ΔG; 4 to 6 hpi for rVSV RABV G). The effect of inhibitor on viral infection was assayed by treating cells with drug prior (pre) or following (post) inoculation with virus. Comparison of pretreated and posttreated samples enables determination of the effect of each inhibitor on viral entry. (B) Fluorescence microscopy of single-cycle rRABV ΔG infection following treatment with inhibitor. The H+ pump inhibitor bafilomycin A1 (BAF A1; 0.1 μM), macropinocytosis inhibitor amiloride (EIPA; 25 μM), and dynamin inhibitor dynasore (100 μM) were tested for their abilities to impact RABV infection. rRABV ΔG infection was detected via expression of the eGFP reporter gene (green). Cell nuclei were labeled with DAPI (blue). (C) Fluorescence microscopy of rVSV RABV G infection following treatment with inhibitors. rVSV RABV G infection is also detected as expression of the eGFP reporter gene (green). Cell nuclei were labeled with DAPI (blue). Images were collected using the same exposure and processed to the same brightness and contrast settings. Dynasore has a moderate effect on the rate of viral-gene expression; as a result, the brightness and contrast were readjusted in the dynasore insets to highlight lower-intensity infected cells. (D) Cytofluorimetric analysis of infection. Total eGFP expression following pretreatment with drug was calculated from mean fluorescence intensites using FlowJo software and expressed as percentages relative to that of controls treated following inoculation (% post). rVSV eGFP (VSV) and rVSV EboV GP (EboV) served as prototypical clathrin-dependent and macropinosome-dependent pathogens, respectively. Statistically significant differences are demarcated by asterisks (Student's t test; P < 0.01).

