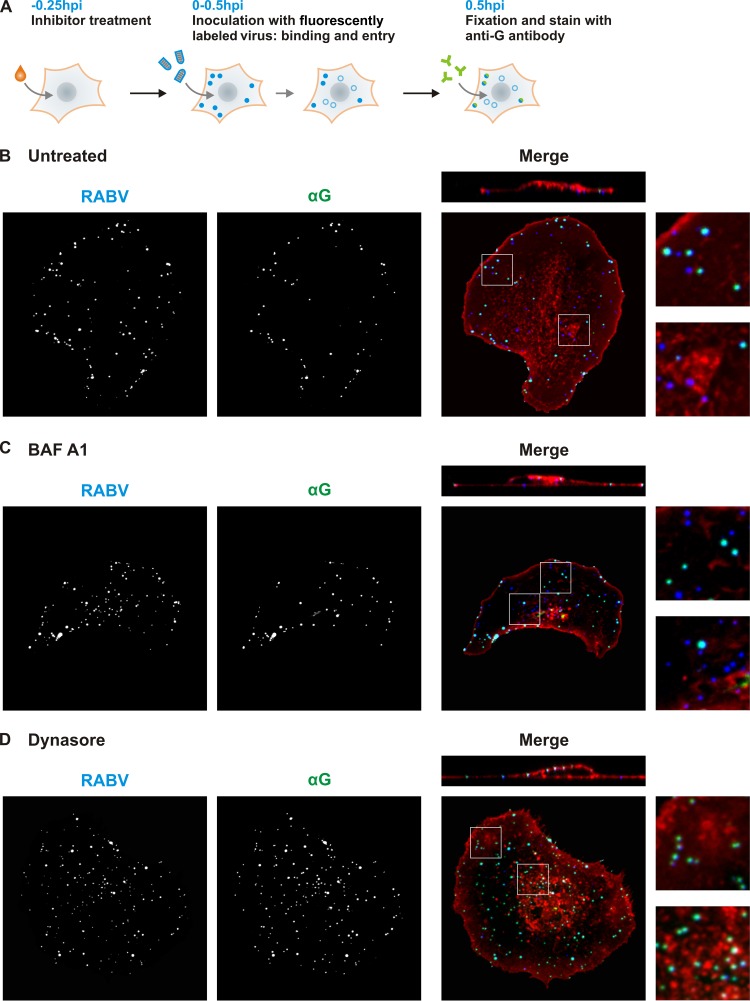
Fig 4.
Dynasore blocks internalization at the plasma membrane. (A) Schematic of internalization assay. Fifteen minutes prior to infection, cells were treated with DMEM only (B), 0.1 uM BAF A1 (C), or 100 uM dynasore (D). AF647-labeled rVSV RABV G virus (MOI = 50) was administered to cells for 30 min. During incubation, surface-bound virus (filled blue circles) internalizes and travels to the perinuclear region (open blue circles). Cells were fixed and stained with antibody against RABV G (αG) in the absence of permeabilization, which exclusively dually labels external particles (blue-green filled circles). Internal particles are protected from αG staining and remain singly labeled (open blue circles). WGA staining was used to detect cell surfaces. (B, C, and D) Confocal microscopy of internalization assay in cells treated as listed above. AF647-labeled rVSV RABV G (RABV) and αG signals are shown individually. In the merged panels, the RABV signal is shown in blue, αG in green, and WGA in red. Singly labeled internal particles appear blue and dually labeled external particles appear cyan. Above the merged images are single-plane z-stack cross sections. Smaller panels (right) show magnified portions of the cells corresponding to the white squares in the merged panels.

