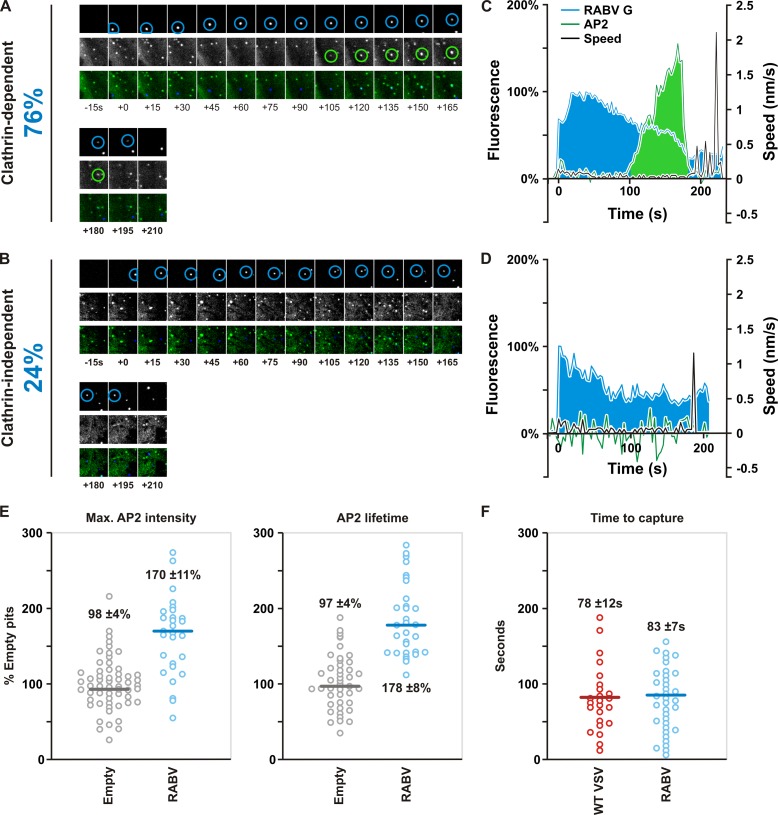
Fig 6.
Live-cell imaging and kinetics analysis of rVSV RABV G internalization. (A) Tile view of images taken from a 10-min time-lapse movie (see Movie S1 in the supplemental material) of rVSV RABV G labeled with AF647 (top, blue) entering a BS-C-1 cell stably expressing AP2-eGFP (middle, green) via clathrin-mediated endocytosis. Particles were imaged at a rate of 20 images min−1. Circles highlight the presence of detectable virus and AP2, respectively. The percentage (at left) refers to the fraction of recorded events that were clathrin dependent (76%; n = 66). (B) Tile view of images taken from a 10-min time-lapse movie (Movie S2) of AF647-labeled rVSV RABV G (top, blue) entering a BS-C-1 cell stably expressing AP2-eGFP (middle, green) in an AP2-independent manner. The percentage (at left) refers to the fraction of recorded events that were clathrin independent (24%; n = 66). (C and D) Graphical representations of the particle behaviors illustrated in panels A and B. AF647-labeled rVSV RABV G fluorescence (RABV G) was plotted as a percentage of its maximum. AP2 was plotted as a percentage of the average maximal fluorescence of empty pits. Particle speed is also plotted on the right y axes. (E) Plots of maximal AP2 intensity and duration during AP2-dependent internalization of rVSV RABV eGFP plotted as a percentage of the average for all measured empty pits. Empty and viral pits are compared. Empty circles refer to individual measurements; bars indicate the median value, which is shown on the plot. For both parameters, the difference between empty and viral pits is statistically significant as determined by Student's t test (P < 10−12). (F) Plot comparing the time between docking and AP2 capture for WT VSV and rVSV RABV G. Empty circles refer to individual measurements; bars indicate the median value, which is shown on the plot. The difference between time to capture of WT VSV and rVSV RABV G is not statistically significant as determined by Student's t test (P > 0.1).

