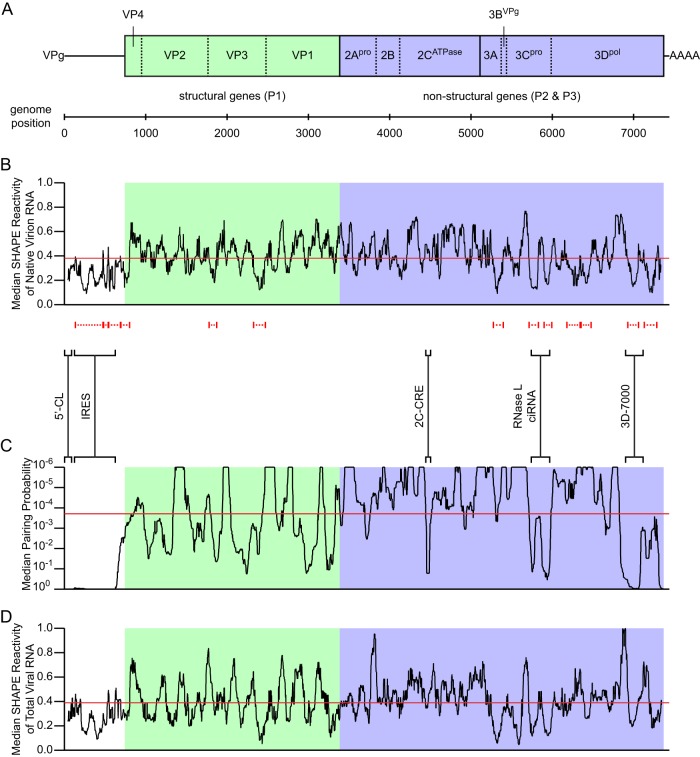
Fig 2.
Organization, SHAPE reactivity, and pairing probability of the poliovirus genome and bootstrap analysis of protein linker regions. (A) Poliovirus genome organization. Untranslated regions are shown as lines, and the open reading frame as a box, with length proportional to nucleotide length. The open reading frame is divided (solid lines) by convention into three domains: P1 (structural genes; light green) and P2 and P3 (nonstructural genes; both light blue). Domains are further divided (dashed lines) into the 11 major viral proteins. (B) Median SHAPE reactivity of native virion RNA. Median SHAPE reactivity is calculated over a sliding 75-nt window (black line). The global median is 0.38 (red line). Regions representing putative local structures identified by SHAPE are marked by dashed red lines (see also Table 1). Regions representing previously described RNA structures, and the 3D-7000 element region targeted by mutagenesis in the current work, are marked by solid black brackets and labeled. (C) Median pairing probability. Median pairing probability is calculated over a sliding 75-nt window (black line). The global median is 1.9 × 10⁻⁴ (red line). Probabilities of <1.0 × 10⁻⁶ are plotted at 1.0 × 10⁻⁶. (D) Median SHAPE reactivity of total viral RNA at 7 h postinfection. Median SHAPE reactivity is calculated over a sliding 75-nt window (black line). The global median is 0.39 (red line).

