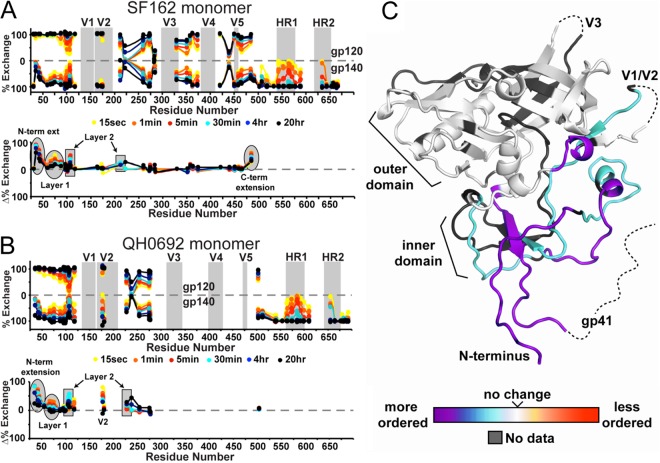
Fig 3.
Butterfly plots comparing the H/D-exchange profiles of monomeric gp120 and gp140. The upper plot shows the exchange profiles of all observable fragments for gp120 (top) and monomeric gp140 (bottom) for isolates SF162 (A) and QH0692 (B). The percent exchange is shown each fragment at the midpoint in primary sequence. For example the exchange profile of fragment 104-110 will be plotted at position 107. The positions of the variable loops and heptad repeats are highlighted in gray. The difference plots under each butterfly plot show the difference in percent exchange at each time point. The exchange plots of each individual fragment are shown in Fig. S1 and S2 in the supplemental material. (C) Differences in exchange profiles between gp120 and monomeric gp140 are shown on the core structure of gp120 (hybrid of PDB 2NY7 and 3JWD as described previously [35]). Regions are colored from purple (more protected/more ordered) to red (less protected/more disordered relative to gp120).

