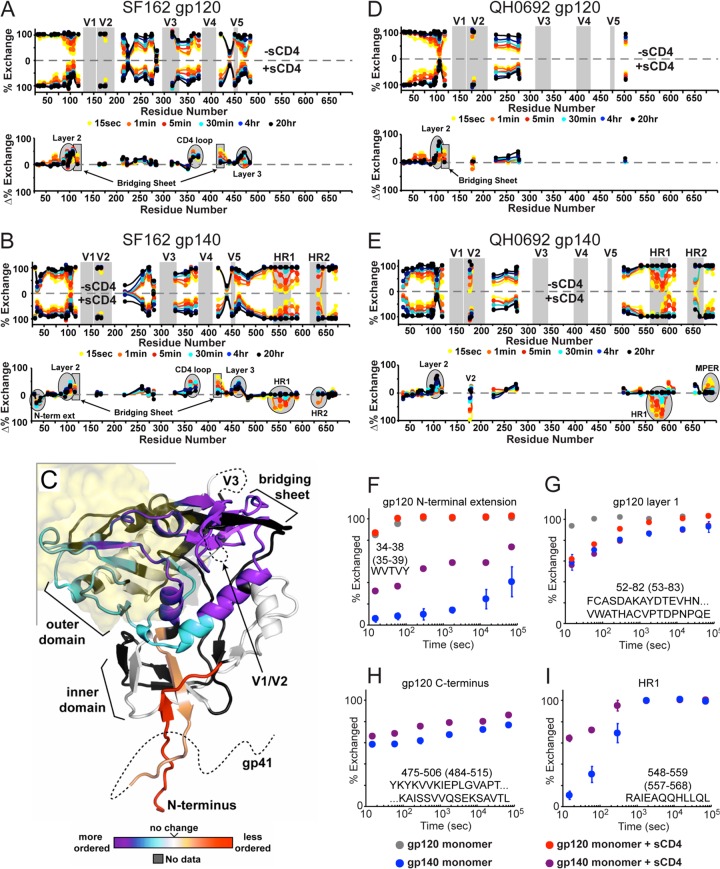
Fig 5.
Effect of CD4 binding to gp120 and gp140 monomers as monitored by H/D exchange. (A, B, D, and E) Butterfly plots for monomeric gp120 with or without sCD4 (A and D) and gp140 monomer with or without sCD4 (B and E). Plot descriptions are described in Fig. 3. (C) Changes in monomeric gp140 upon sCD4 binding shown on the CD4-bound core crystal structure (PDB 3JWD). Regions are colored from purple (more protected/more ordered) to red (less protected/more disordered relative to gp120). The position of CD4 is illustrated as a transparent yellow surface. (F to I) Individual deuterium uptake profiles are shown for peptides (isolate SF162) from the N-terminal extension (F), layer 1 of the gp120 inner domain (G), the C-terminal end of gp120 (H), and HR1 from gp41 (I). Numbering in parentheses refers to HXB2 numbering.

